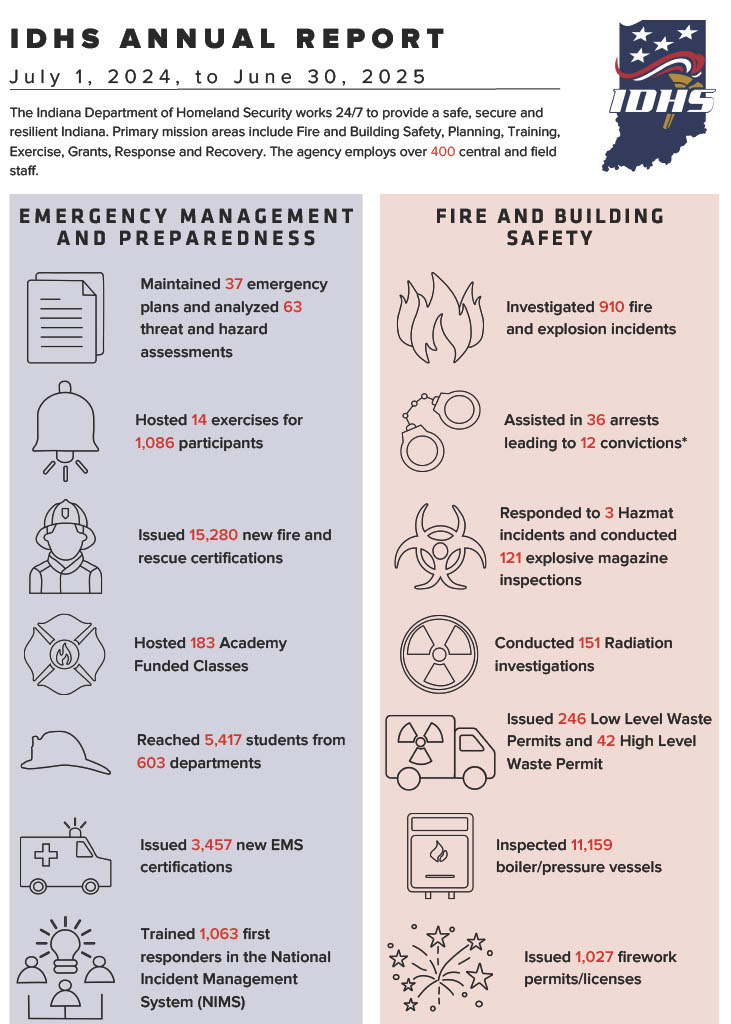
The Indiana Department of Homeland Security (IDHS) leads Indiana's emergency planning and operations, first responder training and fire and building safety. The Division of Fire and Building Safety (within IDHS) oversees building code enforcement, fire investigations and hazmat and radiation programs. It also certifies and trains thousands of first responders each year. The Emergency Management and Preparedness Division works with local and national partners on emergency planning, preparedness and response, including the State Emergency Operations Center (SEOC), which leads response and coordination efforts for large-magnitude incidents. The agency also administers state- and federal-funded grant programs. Learn more about IDHS on the Agency Overview page.
Putting Public Safety Data to Use
Local fire departments and EMS providers regularly submit incident data to IDHS through the ImageTrend system. That information is compiled into reports by national entities, IDHS and others. These reports help spot trends that can drive changes in efforts from the national and state levels to the local level. The data from those reports is also made available to the local agencies and public through interactive dashboards, which show cases when agencies responded to an incident. These are mapped and incident counts are tabulated to help users gain a better understanding of first response activities on the local, county, district and state levels. Similarly, IDHS tracks fatalities that occur in residential settings in an interactive dashboard. Learn more about these dashboards and how they fit into the overall effort to reduce public safety risks on the Community Risk Reduction page.
Requests for data not presented on the IDHS website can be made on the IDHS APRA Portal.
Code Enforcement Inspections
| Fiscal Year | Building Inspections |
| 2024-25 | 18,812 |
| 2023-24 | 18,256 |
| 2022-23 | 15,575 |
| 2021-22 | 13,847 |
| 2020-21 | 12,847 |
| 2019-20 | 13,141 |
| 2018-19 | 13,715 |
| 2017-18 | 12,839 |
Building Plan Review
| Fiscal Year | Construction Design Releases Issued | Variances for Structures Approved |
| 2024-25 | 11,806 | 1,675 |
| 2023-24 | 11,329 | 1,174 |
| 2022-23 | 11,285 | 870 |
| 2021-22 | 11,037 | 905 |
| 2020-21 | 11,007 | 695 |
| 2019-20 | 11,597 | 1,205 |
| 2018-19 | 11,705 | 1,149 |
| 2017-18 | 11,562 | 1,019 |
Fire Investigations
| Fiscal Year | Suspicious Fires Investigated | Arrests |
| 2024-25 | 910 | 36 |
| 2023-24 | 877 | 47 |
| 2022-23 | 815 | 44 |
| 2021-22 | 583 | 35 |
| 2020-21 | 678 | 43 |
| 2019-20 | 535 | 43 |
| 2018-19 | 528 | 21 |
| 2017-18 | 563 | 22 |
Emergency Response Plans
| Fiscal Year | Plans Maintained | Plans Reviewed/Revised/Exercised |
| 2024-25 | 37 | |
| 2023-24 | 37 | 30 |
| 2022-23 | 83 | 13 |
| 2021-22 | 71 | 22 |
| 2020-21 | 71 | 25 |
| 2019-20 | 71 | 12 |
| 2018-19 | 46 | 13 |
| 2017-18 | 24 | 9 |
EMS Certifications
| Fiscal Year | Paramedics Licensed | Emergency Medical Technicians Certified | Advanced Emergency Medical Technicians Certified | Emergency Medical Responders Certified | Primary Instructors Certified | Emergency Vehicle Operator Certifications |
| 2024-25 | 505 | 1,501 | 147 | 656 | 96 | 521 |
| 2023-24 | 393 | 1,330 | 109 | 594 | 101 | 538 |
| 2022-23 | 300 | 1,549 | 124 | 568 | 81 | 310 |
| 2021-22 | 76 | 1,252 | 57 | 601 | 67 | 410 |
| 2020-21 | 302 | 1,184 | 80 | 465 | 65 | 449 |
| 2019-20 | 247 | 1,164 | 68 | 476 | 52 | 462 |
| 2018-19 | 247 | 1,126 | 60 | 541 | 42 | 336 |
| 2017-18 | 281 | 1,088 | 77 | 510 | 52 | 426 |
Emergency Responders, Emergency Managers and Search & Rescue Training
| Fiscal Year | Firefighters, Rescuers, Officers, Investigators & Instructors Certified | Incident Command System Graduates | K-9 Teams, Search & Rescue Graduates |
| 2024-25 | 15,280 | 1,063 | - |
| 2023-24 | 16,354 | 1,139 | 321 |
| 2022-23 | 13,251 | 1,116 | 180 |
| 2021-22 | 12,768 | 938 | 206 |
| 2020-21 | 11,264 | 722 | 164 |
| 2019-20 | 9,726 | 272 | 159 |
| 2018-19 | 11,974 | 757 | 442 |
| 2017-18 | 10,739 | 910 | 467 |
Radioactive Materials Transportation & Emergencies
| Fiscal Year | Total Number of Incidents Responded to | Total Number of Shipment Permits Issued for Highway Route Control Quality Radioactive Materials | Total Number of Shipment Permits Issued for High-Level Radioactive Waste or Spent Nuclear Fuel | Total Number of Shipment Permits Issued for Low-Level Radioactive Waste |
Total Number of Responders Trained for Radiation Response/ Detection |
Total Number of Responders Trained for Radiological Emergency Preparedness/ Nuclear Power Plant |
| 2024-25 | 151 | 42 | - | 246 | 195 | 234 |
| 2023-24 | 137 | 44 | 0 | 220 | 194 | 58 |
| 2022-23 | 99 | 27 | 0 | 181 | 122 | 30 |
| 2021-22 | 141 | 43 | 1 | 162 | 135 | 23 |
| 2020-21 | 400 | 41 | 0 | 167 | - | - |
| 2019-20 | 160 | 32 | 1 | 173 | 258 | 688 |
| 2018-19 | 159 | 63 | 0 | 173 | 400 | 279 |
| 2017-18 | 183 | 35 | 0 | 235 | 395 | 266 |
Chemical Emergency Protection
| Reporting Year | Total Tier II Payments Collected | Annual Tier II Reports Submitted |
| 2024 | $838,130 | 6,851 |
| 2023 | $652,020 | 6,612 |
| 2022 | $744,060 | 6,516 |
| 2021 | $789,440 | 6,438 |
| 2020 | $654,370 | 6,399 |
| 2019 | $674,050 | 6,470 |
| 2018 | $763,860 | 5,932 |
| 2017 | $630,671 | 5,758 |
Emergency Management Performance Grant (EMPG)
The EMPG program makes grants available to states to assist state, local, territorial and tribal governments in preparing for all types of hazards.
| Fiscal Year | Total Dollar Amount of Grants Awarded | Grant Sub-Recipients | Projects | Counties in Which Grants Were Awarded |
| 2024-25 (FFY25) | $3,331,312.00 | 91 | 91 | 91 |
| 2023-24 (FFY24) | $3,303,030.11 | 91 | 91 | 91 |
| 2022-23 (FFY23) | $3,321,392.00 | 91 | 91 | 91 |
| 2021-22 (FFY22) | $3,913,137.00 | 129 | 129 | 90 |
| 2020-21 (FFY21) | $4,534,114.00 | 140 | 140 | 91 |
| 2019-20 (FFY20) | $2,701,067.00 | 91 | 91 | 91 |
| 2018-19 (FFY19) | $3,248,092.00 | 116 | 116 | 92 |
| 2017-18 (FFY18) | $3,790,000.00 | 109 | 113 | 90 |
| 2016-17 (FFY17) | $3,000,000.00 | 158 | 158 | 91 |
| 2015-16 (FFY16) | $3,386,001.50 | 195 | 195 | 90 |
Find more information at the Emergency Management Performance Grant page.
Hazardous Materials Emergency Preparedness (HMEP)
HMEP grants are awarded to Local Emergency Planning Committees (LEPCs) and are used for the following purposes:
- Implementing risk driven, capabilities-based state homeland security strategies
- Supports state and local abilities to prevent, protect against, mitigate, respond to and recover from acts of terrorism and other catastrophic events.
- Developing, improving and implementing emergency plans
- Training public sector hazardous materials emergency response employees to respond to incidents involving hazardous materials in transportation
- Determining flow patterns of hazardous materials within a state and between states
- Determining the need within a state for regional hazardous materials emergency response teams
| Fiscal Year | Total Dollar Amount of Grants Awarded | Grant Sub-Recipients | Projects | Counties in Which Grants Were Awarded |
| 2025-26 (FF26) | $550,423.00 | 36 | 36 | 36 |
| 2024-25 (FFY25) | $375,263.00 | 27 | 27 | 26 |
| 2023-24 (FFY24) | $386,863.00 | 29 | 29 | 29 |
| 2022-23 (FFY23) | $419,110.00 | 35 | 35 | 28 |
| 2021-22 (FFY22) | $393,429.00 | 40 | 40 | 36 |
| 2020-21 (FFY21) | $370,505.00 | 37 | 37 | 34 |
| 2019-20 (FFY20) | $376,624.00 | 47 | 47 | 43 |
| 2018-19 (FFY19) | $279,497.00 | 36 | 36 | 30 |
| 2017-18 (FFY18) | $207,000.00 | 17 | 17 | 17 |
| 2016-17 (FFY17) | $506,202.00 | 34 | 49 | 34 |
| 2015-16 (FFY16) | $372,833.00 | 43 | 65 | 43 |
Find more information at the Hazardous Materials Emergency Preparedness Grant Program page.
Nonprofit Security Grant Program (NSGP)
The Nonprofit Security Grant Program (NSGP) is a competitive grant program for physical security enhancements and other security-related activities to nonprofit organizations that are at risk of a terrorist attack.
| Fiscal Year | Total Dollar Amount of Grants Awarded | Grant Sub-Recipients | Projects | Counties in Which Grants Were Awarded |
| 2023-24 (FFY24) | $9,002,700.00 | 52 | 65 | 22 |
| 2022-23 (FFY23) | $5,920,158.00 | 42 | 45 | 18 |
| 2021-22 (FFY22) | $6,461,517.00 | 42 | 41 | 19 |
| 2020-21 (FFY21) | $4,857,565.00 | 40 | 47 | 16 |
| 2019-20 (FFY20) | $2,436,508.00 | 33 | 33 | 14 |
| 2018-19 (FFY19) | $292,769.00 | 4 | 4 | 4 |
| 2017-18 (FFY18) | $353,810.00 | 5 | 5 | 4 |
| 2016-17 (FFY17) | $121,490.00 | 2 | 2 | 1 |
Find more information at the Nonprofit Security Grant Program page.
Secured School Safety Grant Program
| Fiscal Year | Total Dollar Amount Awarded | Number of Award Recipient Schools or School Systems |
| 2026-27 (FY27) | $26,934,220.86 | 495 |
| 2025-26 (FY26) | $27,031,881.25 | 494 |
| 2024-25 (FY25) | $24,206,587.95 | 499 |
| 2023-24 (FY24) | $29,824,803.67 | 474 |
| 2022-23 (FY23) | $22,911,714.45 | 425 |
| 2021-22 (FY22) | $19,058,808.05 | 392 |
| 2020-21 (FY21) | $19,432,122.54 | 418 |
| 2019-20 (FY20) | $19,081,470.02 | 429 |
| 2018-19 (FY19) | $14,256,526.80 | 388 |
| 2017-18 (FY18) | $7,952,283.06 | 217 |
| 2016-17 (FY17) | $6,332,608.84 | 171 |
| 2015-16 (FY16) | $7,958,281.97 | 225 |
| 2014-15 (FY15) | $8,532,681.26 | 241 |
| 2013-14 (FY14) | $8,357,377.21 | 226 |
Find more information at the Secured School Safety Grant Program page.
Since 2014, more than $244 million has been awarded to Indiana schools that meet the eligibility requirements in their grant requests.
From FY14 to FY27, the Indiana Secured School Grant Board has approved 5,094 grant requests.
Note: Before FY2020, there were only three categories, which were School Resource Officers, Equipment and Threat Assessments. Since FY2020, three categories have been added: Active Event Early Warning System, Student and Parent Support Services, and Other Training.
- FY2027 Award Information
- FY2026 Award Information
- FY2025 Award Information
- FY2024 Award Information
- FY2023 Award Information
- FY2022 Award Information
- FY2021 Award Information
- FY2020 Award Information
- FY2019 Award Information
- FY2018 Award Information
- FY2017 Award Information
- FY2016 Award Information
- FY2015 Award Information
- FY2014 Award Information
State Homeland Security Program (SHSP)
The SHSP program supports the implementation of risk-driven, capabilities-based state homeland security strategies to address capability targets set in urban area, state and regional Threat and Hazard Identification and Risk Assessments (THIRA).
| Fiscal Year | Total Dollar Amount of Grants Awarded | Grant Sub-Recipients | Projects | Counties in Which Grants Were Awarded |
| 2023-24 (FFY24) | $4,144,612.00 | 34 | 34 | 33 |
| 2022-23 (FFY23) | $3,878,000.00 | 35 | 35 | 35 |
| 2021-22 (FFY22) | $4,605,125.00 | 37 | 37 | 26 |
| 2020-21 (FFY21) | $4,372,375.00 | 35 | 35 | 29 |
| 2019-20 (FFY20) | $4,073,125.00 | 38 | 38 | 34 |
| 2018-19 (FFY19) | $3,260,000.00 | 41 | 41 | 28 |
| 2017-18 (FFY18) | $3,184,000.00 | 70 | 70 | 61 |
| 2016-17 (FFY17) | $2,737,334.00 | 54 | 54 | 50 |
| 2015-16 (FFY16) | $1,008,165.00 | 50 | 50 | 42 |
Find more information at the State Homeland Security Program page.
Indiana Local Body Camera Grant Program
| Fiscal Year | Total Dollar Amount Awarded | Number of Award Recipients |
| 2022-23 (FY23) | $479,152 | 30 |
| 2021-22 (FY22) | $1,172,126.38 | 71 |
The state of Indiana, through procedures established by the Indiana State Police and administered by the Indiana Department of Homeland Security, provides matching grants to city, town and county law enforcement agencies for the acquisition of body-worn cameras.
Find more information at the Local Body Camera Grant page.
Indiana Homeland Security Foundation Grant Program
The grant program funded public safety projects at the local level through the sale of Secure Indiana license plates.
| Fiscal Year | Total Dollar Amount of Grants Awarded | Grant Recipients | Counties in Which Grants Were Awarded |
| 2022-23 (FY23) | The Foundation was dissolved in 2023 (House Enrolled Act 1001). | - | - |
| 2021-22 (FY22) | $116,746.00 | 31 | 31 |
| 2020-21 (FY21) | $133,212.00 | 37 | 37 |
| 2019-20 (FY20) | $180,999.94 | 51 | 42 |
| 2018-19 (FY19) | FY19 was skipped to allow the Foundation and Secured School Safety grants to be on the same fiscal cycle. |
- | - |
| 2017-18 (FY18) | $250,854.00 | 66 | 46 |
| 2016-17 (FY17) | $91,561.44 | 31 | 27 |
| 2015-16 (FY16) | $168,364.00 | 98 | 31 |