Overview
This one-stop water quality assessments application was created to provide a more complete picture on activities and information available about water quality, watershed health, and the activities that have been on-going in the Office of Water Quality’s Total Maximum Daily Load (TMDL), Integrated Report, and Nonpoint Source (NPS) Programs. For an overview on how to use this online e303d tool to find pertinent information in your area, follow the instructions below. Otherwise, proceed to the application.
This application has been updated to provide impaired water data from the U.S. EPA’s Assessment TMDL Tracking and Implementation System (ATTAINS). Every two years, all states submit water quality data including a list of impaired waters and use assessment categories to U.S. EPA. As new data is submitted and approved, it is automatically added to the feature data service to provide continuous updates to this application.
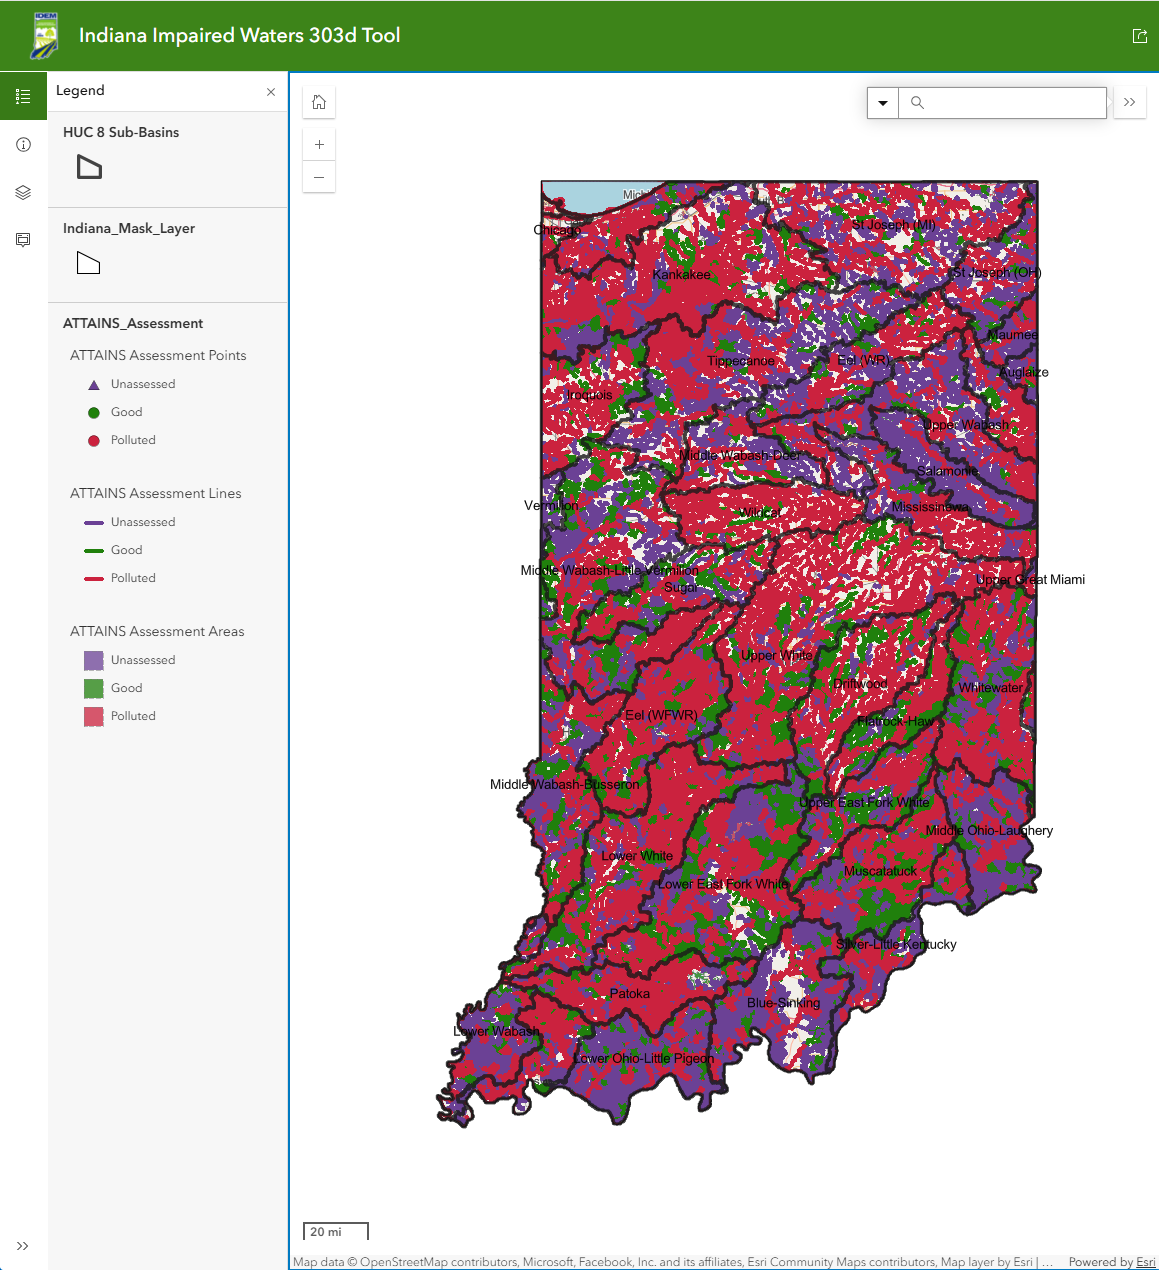
Upon opening the application, you will see the statewide view. Use the zoom buttons in the top left corner to zoom in and out to a location of interest. You may also use the search bar in the top right corner to locate a specific area or watershed. The top right corner also contains a Measure widget, as well as a button to navigate to your current location. Along the left-hand side of the screen, you will see the Legend, a Layers list where you can toggle the layers on or off, details about the map tool, and this is where the pop-up will show up when you click on a waterbody of interest in the map frame.
When entering information in the Search box, the address requires street address, city, or zip code. The county is searched using the Name and State, i.e., Marion County, Indiana. The Indiana Composite Geocoding Service is the Address reference. ;Once you make a selection and enter your search criteria, the map will automatically zoom in and highlight the area around the selection.
From a zoomed in extent, select a stream by clicking a stream feature. A popup box will appear on the left-hand side of the screen, providing access to the fields of data associated with the selected waterbody or watershed. Depending on where you click, the popups present data from both the ATTAINS layers as well as data from the Watershed Management Plan (WMP) and TMDL Reports Search Tool (WATRS Tool). Popup boxes are layered to provide records from different data sources. The bottom left corner of this example popup below shows two records which can be cycled through by clicking the arrow in the bottom left corner of the popup box.
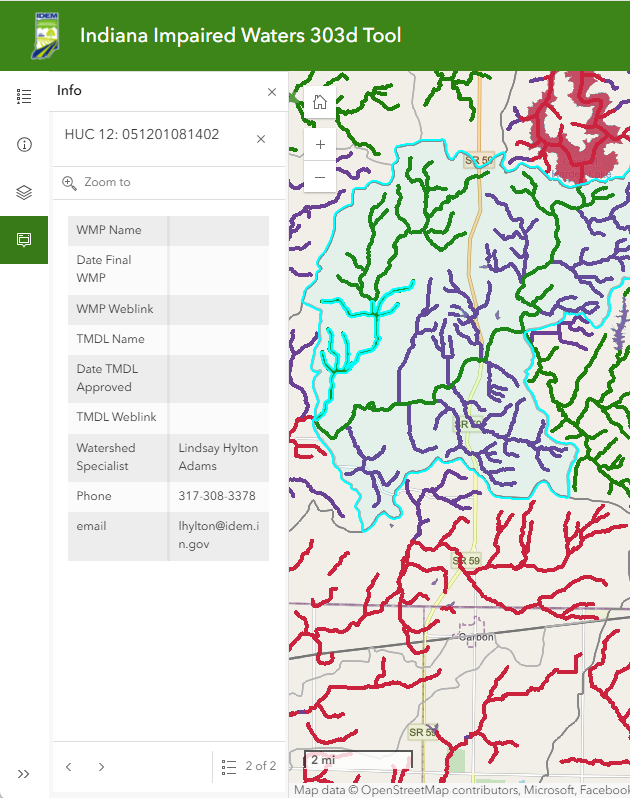
When selecting a stream or waterbody, the initial popup box displays the attributes for the selected record from the ATTAINS Assessment layers, which contain water quality assessment data from the ATTAINS database. This includes the Assessment unit (AU) name and identification code (AUID). The pop-up shows which parameters this AU has been assessed for and what impairments (if any) resulted in placing this stream reach on the 4A, 5A, or 5B category lists in the latest Integrated Report. To display the attributes from the WATRS Tool, click the right arrow in the bottom left corner of the pop-up display. This will show the 12-digit HUC for the waterbody along with the names of and links to any applicable WMPs or TMDLs. The name of and contact information for the IDEM Watershed Specialist for that area of the state is also provided.
- Return to the Impaired Waters e-303d Tool