TUBERCULOSIS 2000
Cases = 145
Crude Incidence Rate per 100,000 population = 2.4
Race/Ethnicity-specific Incidence Rates per 100,000 population
White = 1.4
African-American = 7.8
Asian = 18.0
Hispanic = 10.3
Sex-specific Incidence Rates per 100,000 population
Female = 1.7
Male = 3.1
Tuberculosis (TB) is an airborne disease caused by Mycobacterium tuberculosis. General symptoms associated with TB are a prolonged, productive cough, blood-tinged sputum, night sweats, fever, fatigue, and weight loss. TB usually affects the lungs, but can also affect other parts of the body such as the brain, kidneys, or spine. TB bacilli are aerosolized when a person who has TB of the lungs or larynx coughs, sneezes, laughs, or sings. The bacilli are then inhaled by another person. Individuals who become infected from the inhaled TB bacilli but do not become ill are considered to have latent TB infection and cannot transmit the infection to others. Approximately 10% of the individuals who harbor the bacilli will progress from the stage of latent, or asymptomatic TB infection, to active disease. The majority of this report concerns cases of TB disease.
During 2000, 145 new cases (Figure 1) of tuberculosis were reported to the Indiana State Department of Health (ISDH). This represents a 3.3% decrease from the 150 cases reported in 1999. The state case rate was 2.4 cases per 100,000 population. The 2000 U.S. Bureau of the Census figures were used to calculate the rates reported in this document. TB was reported by 46 (50%) of the 92 counties. Generally, cases were associated with urban and suburban counties.
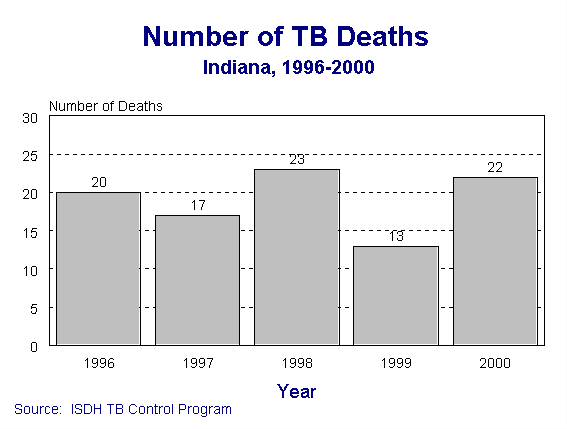
With the advent of chemotherapy, TB is generally treated on an outpatient basis. Chemotherapy has led to a dramatic decline in the number of deaths due to TB disease. During 1996-2000, an average of 19 people died with TB in the state of Indiana. The number of TB-related deaths is shown in Figure 2.
Figure 1.
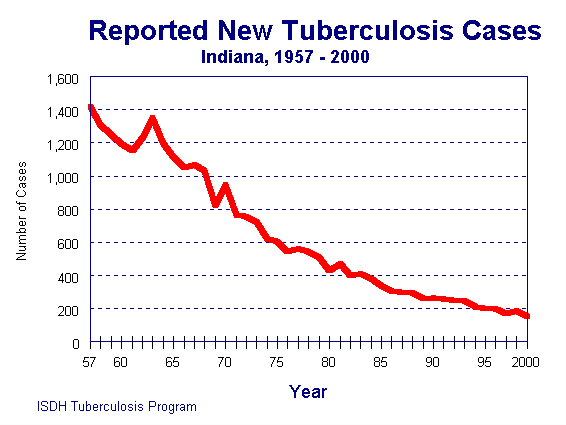
Figure 2.
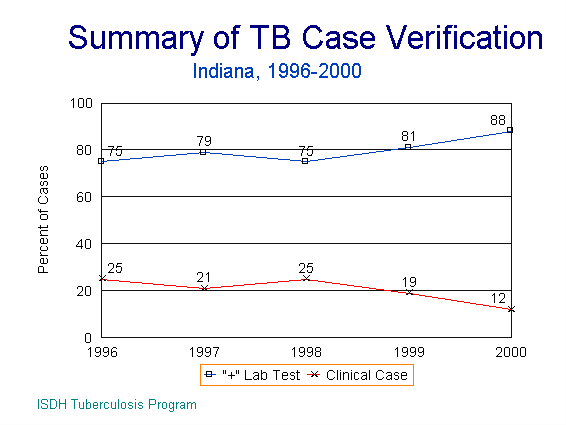
In order for a person diagnosed with TB to be counted as a TB case, the medical record is reviewed by the local health officer or another physician who is familiar with TB. All information is then reviewed by the state TB control officer to ensure that the findings meet the Centers for Disease Control and Prevention’s (CDC) case verification criteria, at which time it is counted as a new TB case. The identification of Mycobacterium tuberculosis complex in a culture includes three species important in human disease: M. tuberculosis, M. bovis, and M. africanum. The case data in this report are compiled from the reports submitted through local health departments to ISDH. Case verification is categorized as either a laboratory or a clinical diagnosis. Laboratory diagnosis is confirmed when M. tuberculosis has been: 1) cultured from a clinical specimen or has been demonstrated in a clinical specimen by a nucleic acid amplification (NAA) test approved by the FDA, or 2) acid fast bacilli (AFB) are seen when a culture has not or cannot be obtained (usually used only to aid in a post-mortem diagnosis). A clinical case is one in which the individual has a positive tuberculin skin test, other signs and symptoms compatible with TB disease (e.g., an abnormal, unstable chest x-ray, or clinical evidence of current disease), treatment with two or more anti-TB drugs, has completed a medical evaluation, and is showing clinical improvement. Many in this category include culture-negative pulmonary TB, extra-pulmonary TB where laboratory confirmation may be lacking due to the site of the disease, and children in whom obtaining specimens is difficult and invasive procedures are not warranted. Figure 3 shows the percentage of reported TB cases by verification criteria.
Figure 3.
As in years past, more males were diagnosed with TB than females (Figure 4). In 2000, males represented 64.0% of the newly diagnosed TB cases. The case rate per 100,000 population was 3.1 for males and 1.7 for females.
Figure 4.
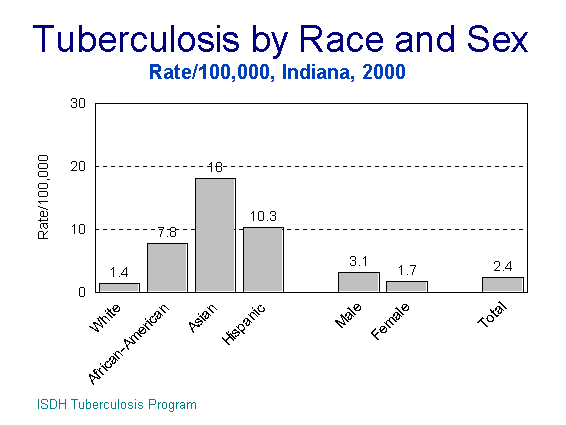
Case rates per 100,000 population by race and ethnicity were 1.4 for whites, 7.8 for African-Americans, 10.3 for Hispanics, and 18.0 for Asians. Although foreign-born persons had the greatest rates of TB, the number living in Indiana remains relatively small, but is increasing. For this reason, the rates in this group may be unstable.
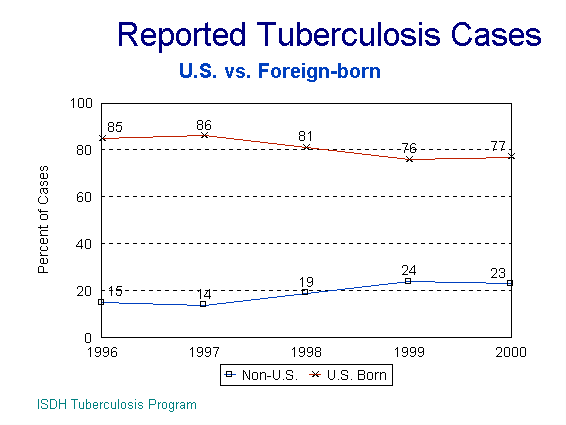
In 2000, 23.4% (34/145) of cases were foreign-born, which means the country of origin was a country other than the U.S. (Figure 5). Among the foreign-born, Latin America and the Caribbean accounted for 44.1% (15/34) of the cases. These individuals came from Mexico (13), Honduras (1), and Jamaica (1). South, east, and southeast Asia accounted for 32.4% (11/34) of the foreign-born cases, with patients coming from Vietnam (2), the Philippines (2), Burma (1), Malaysia (1), and India (5). Africa represented 17.6% (6/34), with patients from Malawi (2), Zimbabwe (1), Kenya (1), and Ethiopia (2). The remaining 5.9% (2/34) came from Europe. Both of these patients were from Russia.
Figure 5.
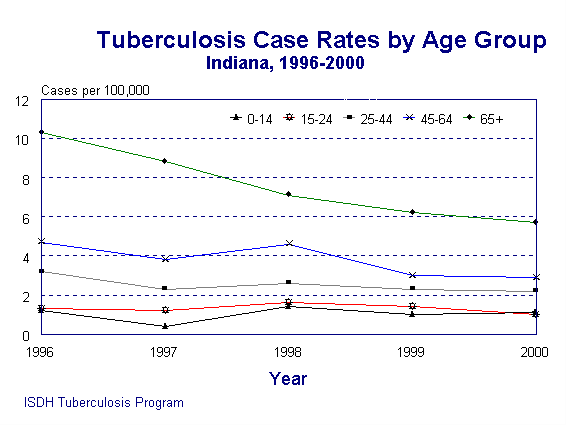
In Indiana, the incidence of TB has been higher in older individuals (Figure 6). The case rate in this group has steadily declined. In 2000, 29.7% of the cases occurred in those who were over age 65, with a case rate of 5.7 per 100,000; 26.9% were age 45-64 with a case rate of 2.9. The age group of 25-44 represented 27.6% of the cases for a case rate of 2.2, and 6.2% were age 15-24 for a case rate of 1.0. This year, 9.7% were under the age of 14 for a case rate of 1.1.
Figure 6.
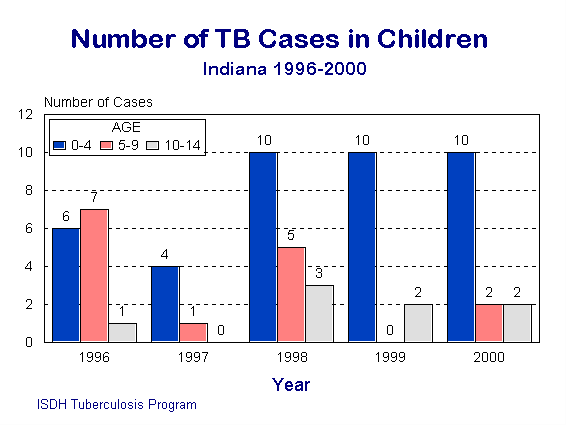
Fourteen children under the age of 15 were diagnosed in 2000 (Figure 7). Ten children were four years of age or younger. TB in young children represents recent transmission of TB, usually from an adult to a child.
Figure 7.
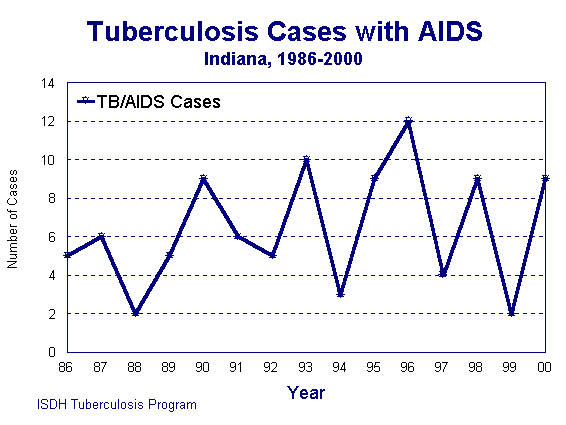
Several risk factors are associated with the development of TB disease or progression from infection to disease. The most important of these factors is HIV disease. In 2000, there were nine individuals diagnosed with both TB and HIV (Figure 8) compared to the two co-infected individuals in 1999. During 2000, HIV status was known for approximately 33% of the cases. HIV testing was not offered in 64% of the cases. Due to the small numbers of individuals diagnosed with both TB and HIV, significant variation in the numbers of cases identified can be expected to occur due to chance alone. National guidelines recommend HIV counseling and testing for all patients with TB.
Figure 8.
Other risk factors associated with TB are alcohol use, homelessness, illicit drug use (injecting and non-injecting), residence or employment in a high-risk congregate setting, or employment as a health care worker (HCW) serving high-risk clients. The breakdown can be see in Table 1.
Table 1.
Number of Reported Tuberculosis Cases
by Risk Factor, 2000 (n=145)
Risk Factor | Yes (%) | No (%) | Unknown (%) |
Alcohol use | 26 (18) | 119 (82) | NA |
Homelessness | 2 (1) | 143 (99) | NA |
Injection drug use | 5 (4) | 140 (96) | NA |
Non-injection drug use | 10 (7) | 135 (93) | NA |
LTC resident | 5 (4) | 140 (96) | NA |
Health care worker | 4 (3) | 141 (97) | NA |
Prison/Jail employee | NA | NA | NA |
Prison inmate | 4 (3) | 141 (97) | NA |
Occupation is another variable used to detect trends. Compilation of these data show that 62.8% of the individuals diagnosed with TB disease were unemployed and 37.2% had known employment (Table 2). The unemployed category includes retired persons, children, and students. Four health care workers were diagnosed with disease in 2000, with one of those being patient-to-employee transmission confirmed by RFLP analysis.
Table 2.
Number of Reported Tuberculosis Cases
by Occupation, 2000 (n=145)
Occupation | Number of Cases | Percent of Cases |
Unemployed | 91 | 62.8% |
Other occupations | 50 | 34.5% |
Unknown | 0 | 0% |
Migrant agricultural worker | 3 | 2% |
Health care worker | 4 | 2.7% |
Corrections worker | 0 | 0% |
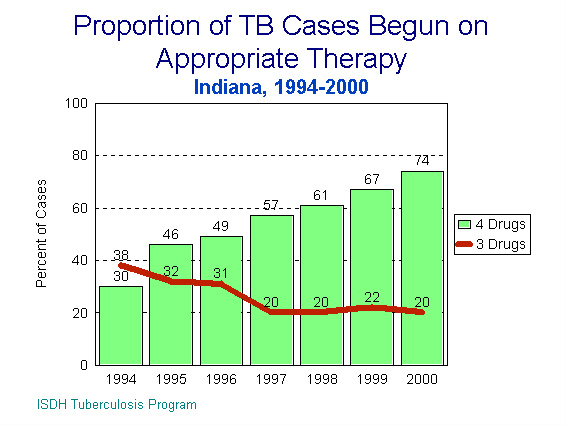
Of the 145 cases reported in 2000, 86.2% (125/145) were exclusively pulmonary. Another 6.2% (9/145) were both pulmonary and extra-pulmonary. Pulmonary cases are the main public health concern since these individuals actively transmit the disease to others. To break this cycle of transmission, appropriate therapy must be initiated and continued for the duration of the treatment period. ISDH follows the treatment guidelines set by the American Thoracic Society and the Centers for Disease Control and Prevention (ATS/CDC). Since 1991, these guidelines have recommended that four drugs be used in the initial regimen. Figure 9 shows the impact of those guidelines on the prescribing practices of physicians. In 2000, 74% (102/138) of the patients alive at the time of diagnosis initiated therapy on the preferred regimen containing isoniazid, rifampin, and pyrazinamide, with either ethambutol or streptomycin included until drug susceptibility results were available. The percentage of patients who were started on at least isoniazid, rifampin, and pyrazinamide was 20.3% (28/138). Seven patients were dead at the time of diagnosis. A post-mortem diagnosis of TB suggests that there were either delays in the patient seeking treatment or in the diagnosis of TB. Disease transmission may have occurred before anyone suspected TB. Contact investigations based on the late diagnosis are crucial to protect the survivors.
Figure 9.
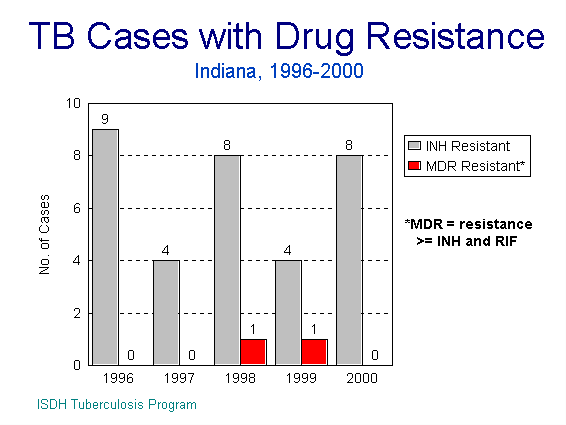
Drug susceptibility testing should be performed on all positive TB cultures to detect any resistance to the medications prescribed. Of the 145 TB cases reported, 4.8% (7/145) were resistant to at least one anti-tuberculosis drug. One case reported in 1999 developed INH resistance during 2000. In 2000, susceptibility testing was performed on 96.8% (121/125) of initial positive cultures. Drug susceptibility testing is automatically done on all initial positive cultures submitted to the State TB Laboratory. Private laboratories do not perform them unless requested. Multi-drug resistant (MDR) TB is defined as resistance to both isoniazid and rifampin. MDR-TB is of particular public health concern since these two drugs are the most effective medications used to treat TB. If the organism is resistant to them, less effective second-line drugs must be added, with the treatment period having to be extended to 18-24 months. There were no cases of MDR-TB in Indiana in 2000.
INH-resistant TB is treatable and curable with the remaining three first-line drugs. Close and careful monitoring of these patients is necessary to prevent additional drug resistance. Drug resistance was documented in the following counties: Marion (1-rifampin and streptomycin, 1-pyrazinamide), Warrick (isoniazid), Montgomery (isoniazid), DeKalb (pyrazinamide), Madison (pyrazinamide), and Grant (isoniazid). An Allen County patient reported in 1999 developed resistance to isoniazid in 2000, and is included in Figure 10.
Figure 10.
Besides drug resistance, inadequate response to therapy and non-compliance are major reasons for having to extend the treatment period. Patients whose cultures have not become negative or whose symptoms have not improved after two months of therapy should be re-evaluated for drug resistance, as well as failing to adhere to the treatment regimen. The proportion of patients who convert their sputum cultures to negative within 90 days is shown in Figure 11.
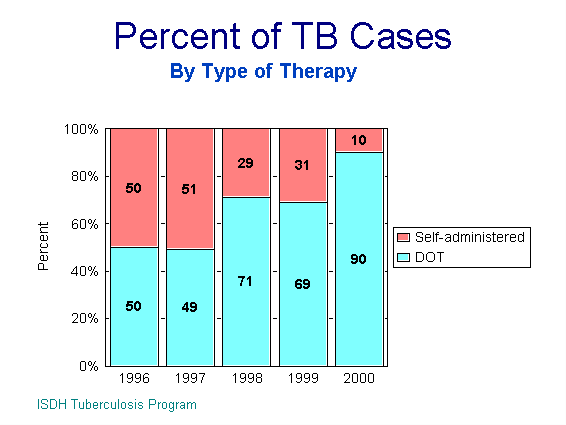
The most effective method to assure that the patient is complying with the prescribed regimen is to use directly observed therapy (DOT). DOT is a strategy proven to ensure completion of therapy, thereby preventing the emergence of acquired drug resistance. DOT is the standard of care in Indiana. Its use ensures compliance with and completion of therapy and should be used for all TB patients. Every effort must be made to initiate DOT when the patient is first started on anti-TB medications, especially pulmonary and drug resistant cases. During 2000, 90% (129/138 alive at the time of diagnosis) of all cases were on DOT for at least some portion of the treatment period (Figure 12).
Figure 11.
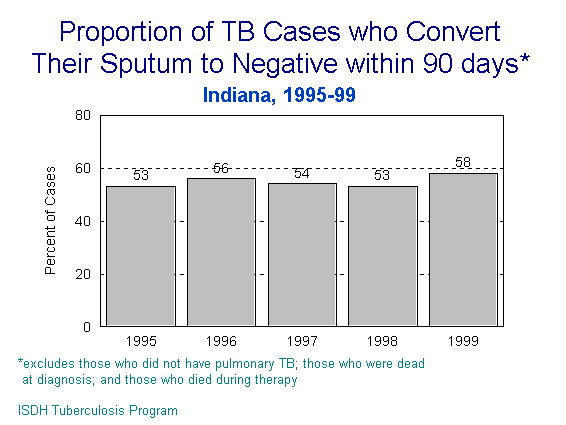
Figure 12.
The top priority of TB control and prevention efforts is to ensure completion of therapy for TB patients. Indiana’s objective is to have at least 90% of all patients complete an adequate and appropriate course of therapy within one year. The completion of therapy index is calculated for groups of cases by dividing the number of cases who complete therapy within one year by the total number of cases who are expected to complete therapy within one year. Exclusions from the rate calculations are those who were dead at the time of diagnosis, patients who died before completing therapy, patients who were never started on therapy, and patients with multi-drug resistant disease. Therapy is considered to be incomplete for those patients who were reported as moved, uncooperative or refused, or lost to follow-up.
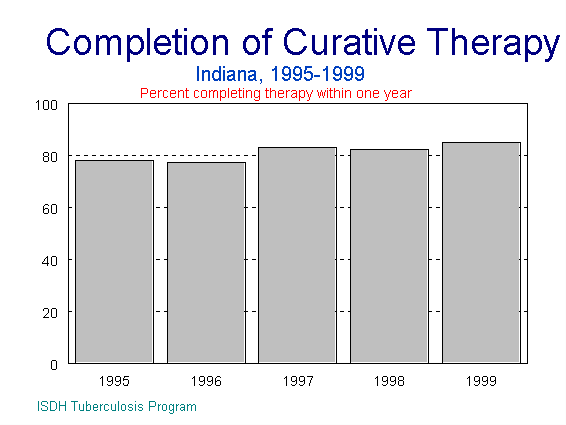
Because completion data are gathered at the end of therapy, the current data are for those patients who initiated therapy in 1999. The completion rate for that year was 85%, as shown in Figure 13.
Figure 13.
The second priority in TB control and prevention is to identify close contacts to patients with active pulmonary or laryngeal TB. Individuals with latent TB infection (LTBI) who are recent close contacts of an active case are at a much higher risk of progressing to active disease than those with LTBI who were not recent close contacts. Contact investigations should be initiated within three working days for sputum smear-positive cases that have a high degree of suspicion for TB. Contact investigations must be performed for all cases of laryngeal and sputum culture-positive pulmonary TB. Persons in the following categories who have LTBI are also at high risk for developing active disease once infected and should be treated regardless of their age: 1) individuals who have converted their skin test from negative to positive within the last two years; 2) injection drug users; 3) persons known or suspected of having HIV infection; 4) persons with certain other medical conditions; 5) persons with a chest x-ray suggestive of previous TB who received inadequate treatment; and 6) persons from countries where TB is common.
During 2000, 136 pulmonary TB cases were diagnosed. Figure 14 gives the percentages of contacts to active cases in 1999 who completed treatment for LTBI.
Figure 14.
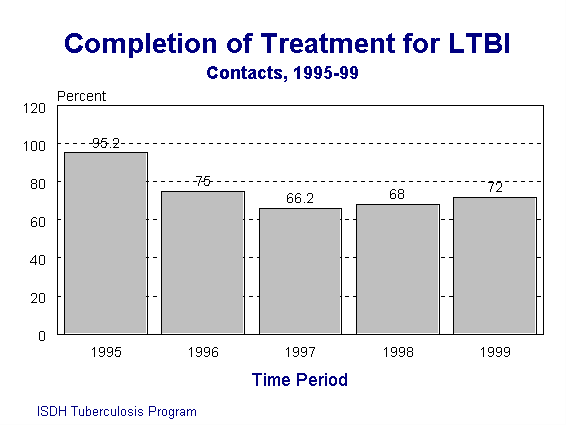
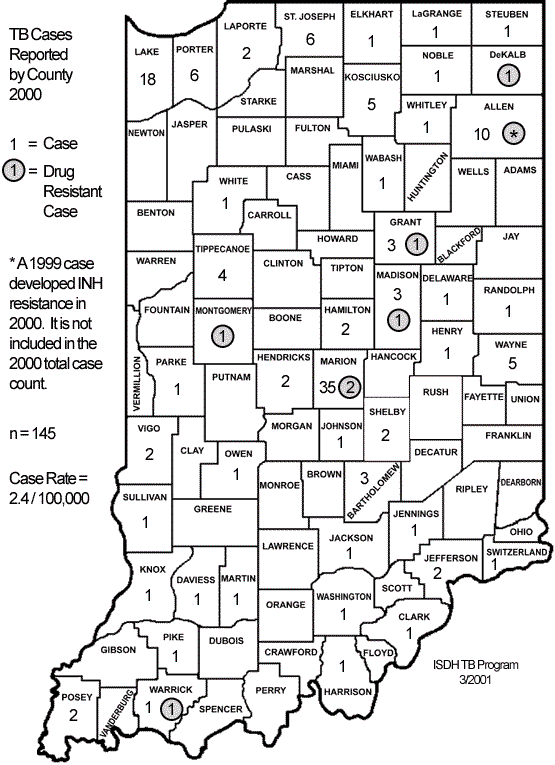
Figure 15 gives an overview of where the TB cases occurred within the state. The numbers represent the number of persons in each county who had an Indiana address at the time of diagnosis and who were verified as having TB disease in 2000. Persons counted in another state and immigrants and refugees who are diagnosed and begin treatment abroad are excluded. Foreign visitors diagnosed in Indiana but who will remain in the U.S. for less than 90 days of treatment are also excluded. The numbers of drug-resistant cases are in the dark circle. TB was reported by 46 (50%) of the 92 counties. Eight drug-resistant cases were reported in seven different counties.
Figure 15.
Number and Rate of TB Cases | LaPorte | 110106 | 2 | 1.8 | ||||
Lawrence | 45922 | 0 | 0 | |||||
2000 | Rate per | Madison | 133358 | 4 | 3.0 | |||
County | Population | Cases | 100,000 | Marion | 860454 | 37 | 4.3 | |
Adams | 33,625 | 0 | 0 | Marshall | 45128 | 0 | 0 | |
Allen | 331849 | 10 | 3.0 | Martin | 10369 | 1 | 9.6 | |
Bartholomew | 71435 | 3 | 4.2 | Miami | 36082 | 0 | 0 | |
Benton | 9421 | 0 | 0 | Monroe | 120563 | 0 | 0 | |
Blackford | 14048 | 0 | 0 | Montgomery | 37629 | 1 | 2.7 | |
Boone | 46107 | 0 | 0 | Morgan | 66689 | 0 | 0 | |
Brown | 14957 | 0 | 0 | Newton | 14586 | 0 | 0 | |
Carroll | 20165 | 0 | 0 | Noble | 46275 | 1 | 2.2 | |
Cass | 40930 | 0 | 0 | Ohio | 5623 | 1 | 17.8 | |
Clark | 96472 | 1 | 1.0 | Orange | 19306 | 0 | 0 | |
Clay | 26556 | 0 | 0 | Owen | 21786 | 1 | 4.6 | |
Clinton | 33866 | 0 | 0 | Parke | 17241 | 1 | 5.8 | |
Crawford | 10743 | 0 | 0 | Perry | 18899 | 0 | 0 | |
Daviess | 29820 | 1 | 3.4 | Pike | 12837 | 1 | 7.8 | |
Dearborn | 46109 | 0 | 0 | Porter | 146798 | 6 | 4.1 | |
Decatur | 24555 | 0 | 0 | Posey | 27061 | 2 | 7.4 | |
DeKalb | 40285 | 1 | 2.5 | Pulaski | 13755 | 0 | 0 | |
Delaware | 118769 | 1 | 0.8 | Putnam | 36019 | 0 | 0 | |
Dubois | 39674 | 0 | 0 | Randolph | 27401 | 1 | 3.6 | |
Elkhart | 182791 | 1 | 0.5 | Ripley | 26523 | 0 | 0 | |
Fayette | 25588 | 0 | 0 | Rush | 18261 | 0 | 0 | |
Floyd | 70823 | 0 | 0 | St. Joseph | 265559 | 6 | 2.3 | |
Fountain | 17954 | 0 | 0 | Scott | 22960 | 0 | 0 | |
Franklin | 22151 | 0 | 0 | Shelby | 43445 | 2 | 4.6 | |
Fulton | 20511 | 0 | 0 | Spencer | 20391 | 0 | 0 | |
Gibson | 32500 | 0 | 0 | Starke | 23556 | 0 | 0 | |
Grant | 73403 | 4 | 5.4 | Steuben | 33214 | 1 | 3.0 | |
Greene | 33157 | 0 | 0 | Sullivan | 21751 | 1 | 4.6 | |
Hamilton | 182740 | 2 | 1.1 | Switzerland | 9065 | 1 | 11.0 | |
Hancock | 55391 | 0 | 0 | Tippecanoe | 148955 | 4 | 2.7 | |
Harrison | 34325 | 1 | 2.9 | Tipton | 16557 | 0 | 0 | |
Hendricks | 104093 | 2 | 1.9 | Union | 7349 | 0 | 0 | |
Henry | 48508 | 1 | 2.1 | Vanderburgh | 171922 | 0 | 0 | |
Howard | 84964 | 0 | 0 | Vermillion | 16788 | 0 | 0 | |
Huntington | 38075 | 0 | 0 | Vigo | 105848 | 2 | 1.9 | |
Jackson | 41335 | 1 | 2.4 | Wabash | 34960 | 1 | 2.7 | |
Jasper | 30043 | 0 | 0 | Warren | 8419 | 0 | 0 | |
Jay | 21806 | 0 | 0 | Warrick | 52383 | 2 | 3.8 | |
Jefferson | 31705 | 2 | 6.3 | Washington | 27223 | 1 | 3.7 | |
Jennings | 27554 | 1 | 3.6 | Wayne | 71097 | 5 | 7.0 | |
Johnson | 115209 | 1 | 0.9 | Wells | 27600 | 0 | 0 | |
Knox | 39256 | 1 | 2.6 | White | 25267 | 1 | 4.0 | |
Kosciusko | 74057 | 5 | 6.8 | Whitley | 30707 | 1 | 3.3 | |
LaGrange | 34909 | 1 | 2.7 | Indiana | 6080485 | 145 | 2.4 | |
Lake | 484564 | 18 | 3.7 | |||||