Indiana ag by the numbers
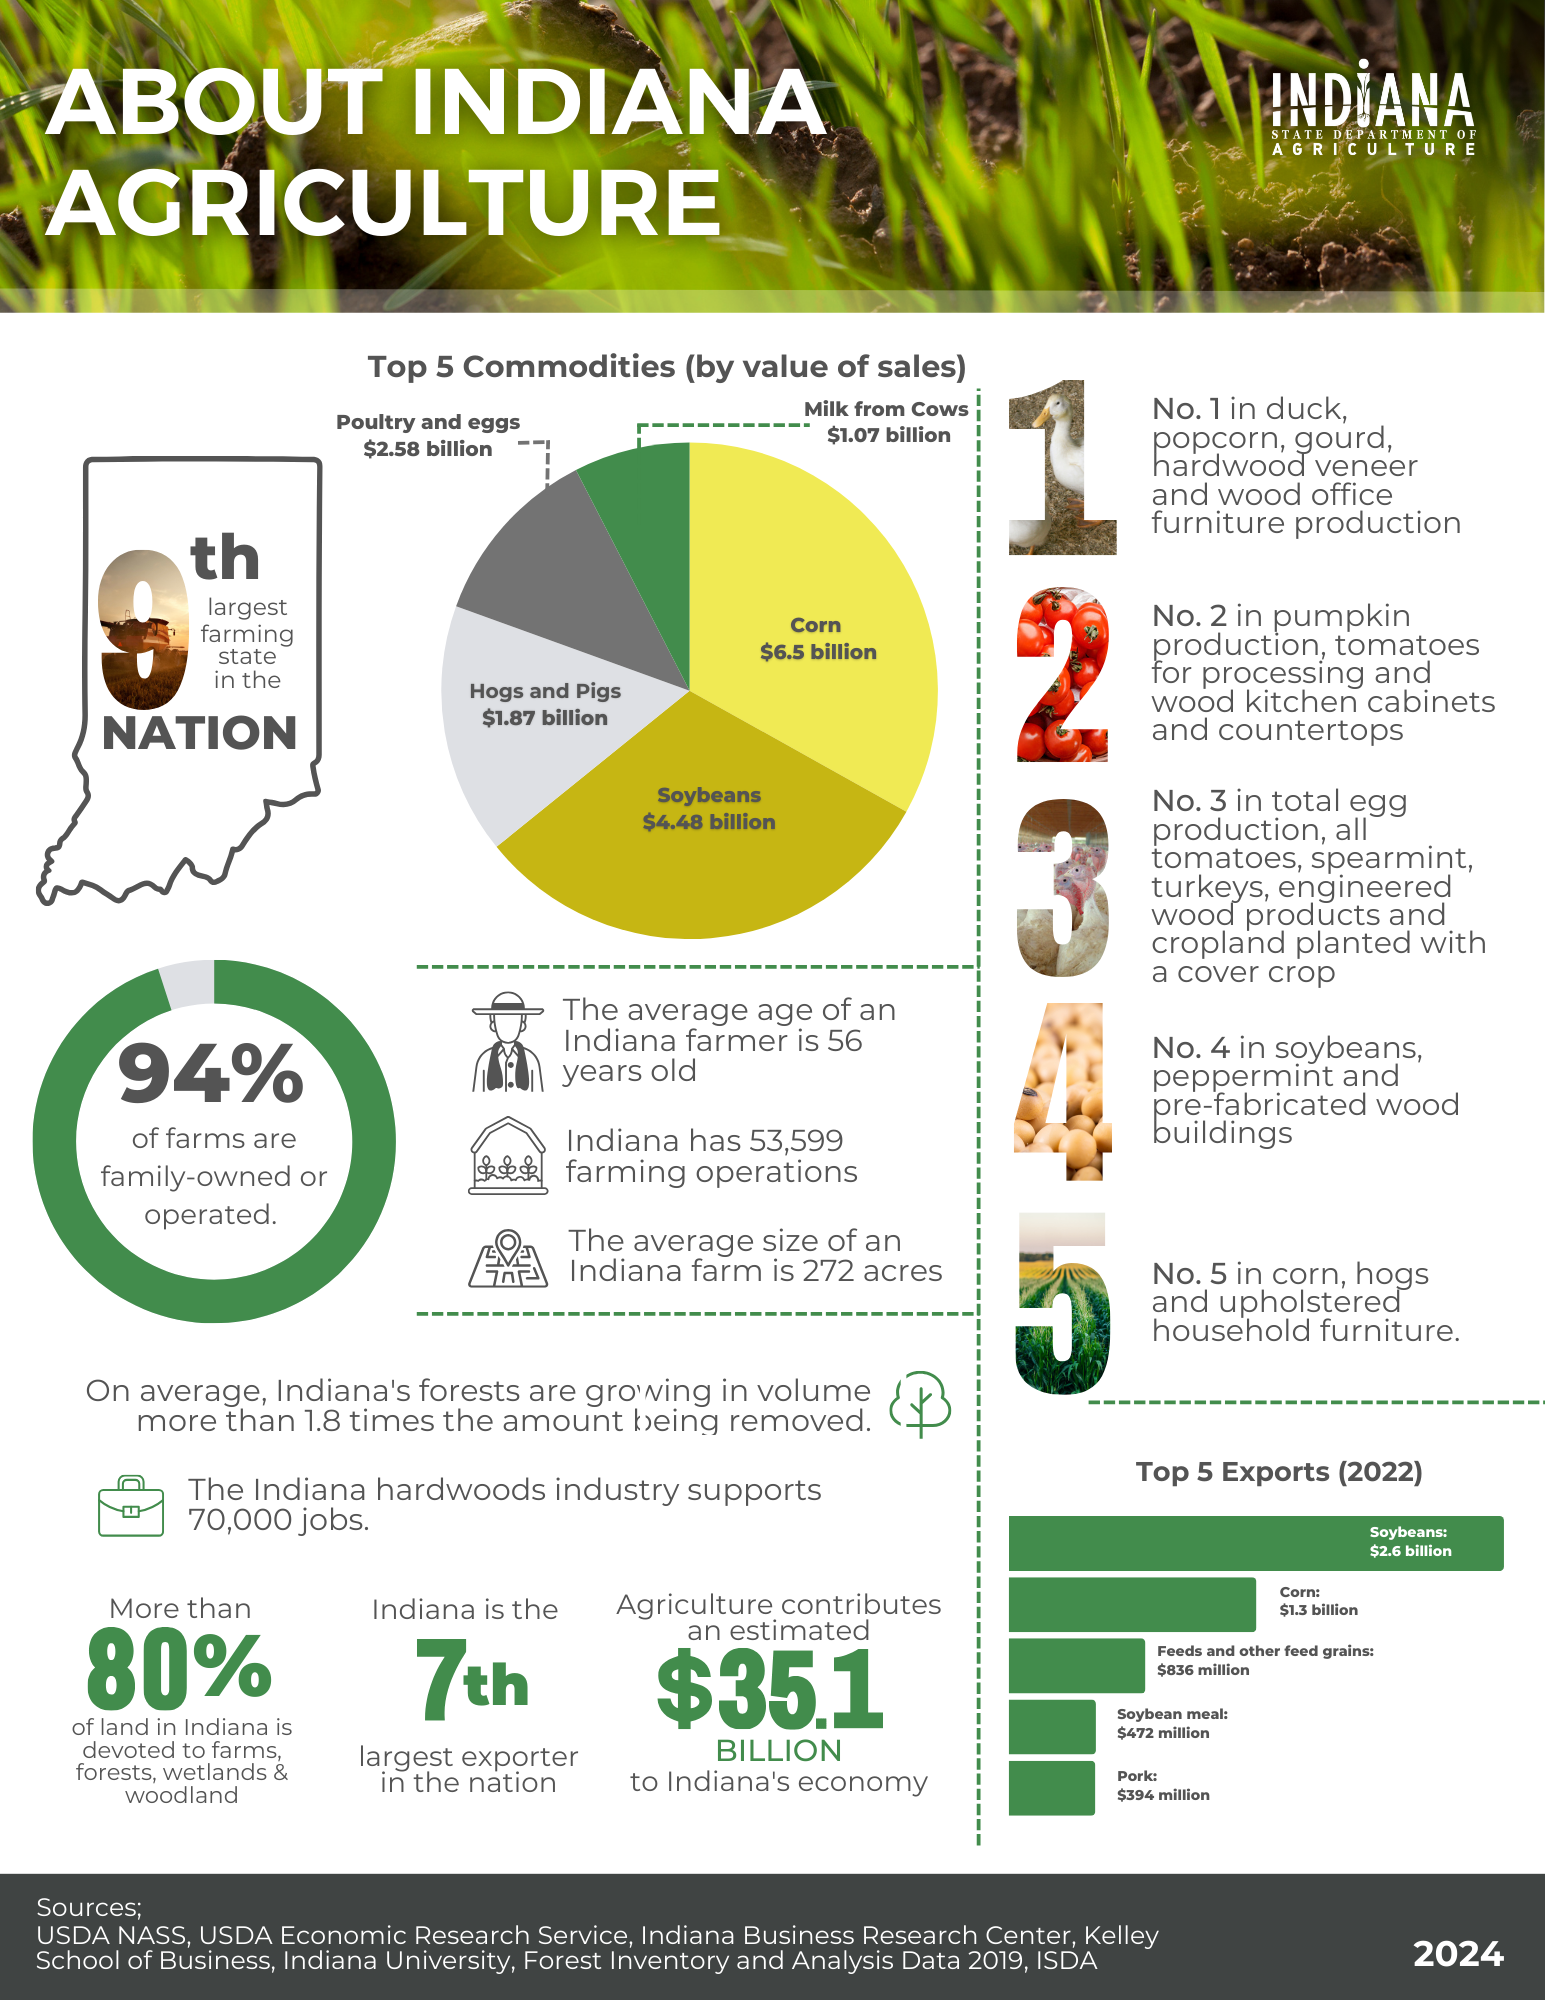
- Agriculture contributes an estimated $35.1 billion to Indiana’s economy. 3
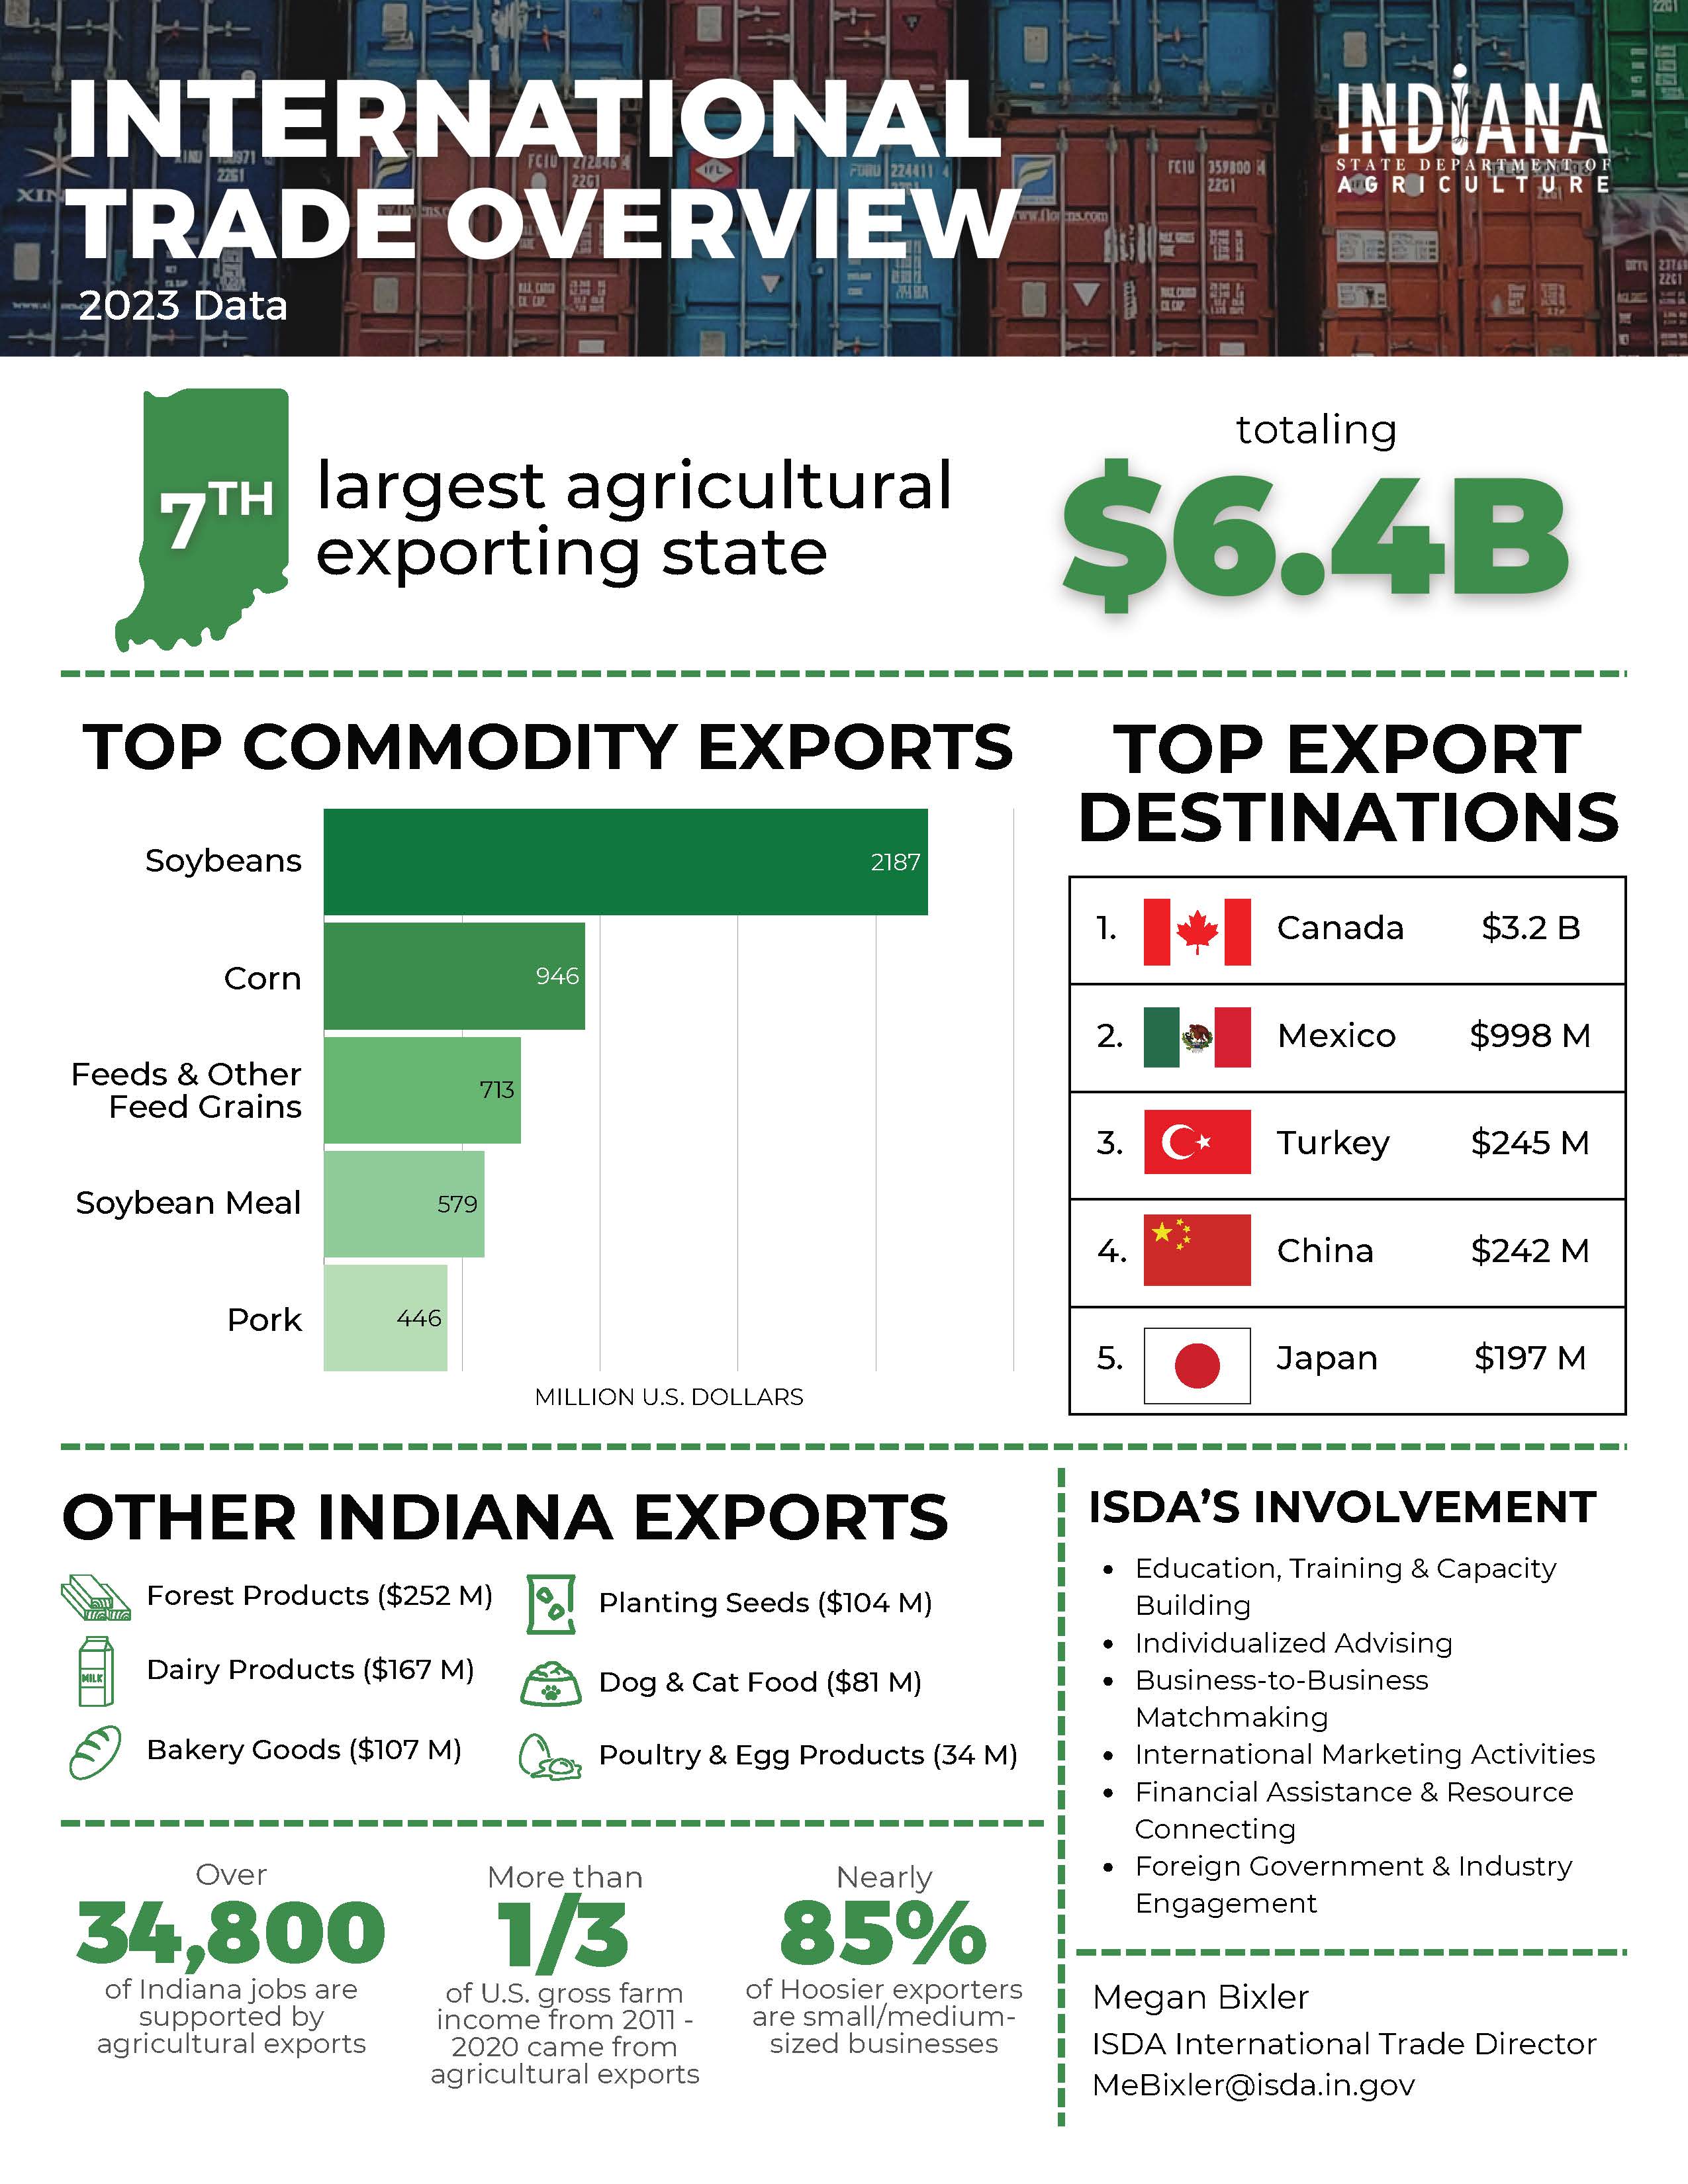
- Indiana is the seventh largest agricultural exporter in the nation, exporting $6.358 billion in 2023. 2
- The value of unprocessed agricultural commodities sold was $18 billion in 2022. 1
- Indiana is the ninth largest farming state in the nation. 1
- The Indiana hardwoods industry has an annual economic impact of over $10 billion. 4
- There are FFA chapters in 90 of the 92 counties in Indiana. 6
- 94 percent of farms are family-owned or operated. 1
- Indiana has 53,599 farming operations, with an average farm size of 272 acres. 1
- There are more than 8.4 million turkeys in Indiana.1
- There are just over 94,000 farmers in Indiana. 1
- The average age of an Indiana farmer is 56 years old. 1
- There are more than 1.7 million ducks in Indiana. 1
- Indiana's farmers cultivated nearly 14.6 million acres of farmland in 2022. 1
- Approximately 162,000 private landowners own approximately 77% of the timberland in Indiana. In 2018, 3.6 million acres of timberland was classified as "private" ownership. 4
- Hoosier forests offer a sustainable and natural raw material for manufactures. On average, Indiana's forests are growing in volume more than 1.8 times the amount being removed. 4
- Indiana’s hardwood industry supports 70,000 jobs -- 44,000 in primary and secondary manufacturing and 26,000 in ancillary sectors. 4
- There are more than 4.3 million hogs in Indiana. 1
- In 2021 Indiana farmers planted 1.5 million acres of living or overwintering covers (like cover crops). 6
- Through the Conservation Reserve Enhancement Program Hoosier landowners planted 73,416 trees in 2022. 6
Sources: USDA NASS 1; USDA Economic Research Service 2; Indiana Business Research Center, Kelley School of Business, Indiana University 3; Forest Inventory and Analysis Data 2019 4, Indiana DNR 5, ISDA 6
Top 5 national rankings
- No. 1 in commercial duck production, popcorn production, gourd production, hardwood veneer and wood office furniture
- No. 2 in pumpkin production, tomatoes for processing, and wood kitchen cabinets and countertops
- No. 3 in total egg production, tomatoes, spearmint, engineered wood products and cropland planted with a cover crop
- No. 4 in soybeans, turkeys, peppermint and pre-fabricated wood buildings
- No. 5 in corn, upholstered household furniture, watermelon production and hogs
- No. 10 in maple syrup and hemp for floral (CBD and other cannabinoid usage)
Source: USDA NASS
Top 10 agricultural exports in 2023
1.Soybeans: $2.187 billion
2.Corn: $946 million
3.Feeds and other feed grains: $713 million
4.Soybean meal: $579 million
5.Pork: $446 million
6.Grain products: $266 million
7.Other poultry products: $236 million
8.Other plant products: $225 million
9.Vegetable oils: $211 million
10.Dairy products: $166 million
Source: USDA Economic Research Service
Sustainability
To explore how Indiana agriculture is making strides in sustainability, click here.
Indiana ag infographic
To download and print the infographic, click here.
Indiana international trade infographic
To download and print the infographic, click here.
Rural Indiana stats
The Indiana State Department of Agriculture partnered with Purdue University and the Indiana Office of Community and Rural Affairs to develop an online mapping tool to identify a variety of data, such as, housing, fiscal, socio-economic and agriculture and forestry. Rural Indiana Stats is designed to provide individuals, leaders, organizations and agencies with access to a basic set of data that can used to guide and inform their program and investment activities. While the site is not intended to provide a full array of data items available at the county level, it is designed to offer users ready access to a core set of statistical data on Indiana’s 92 counties. These include information on the socioeconomic, housing, and the fiscal attributes of each county. An added benefit of the site is the typologies that are available to determine the geographic classification of Indiana’s 92 counties, such as their metropolitan or nonmetropolitan status. To learn more click here or visit pcrd.purdue.edu/ruralindianastats/.