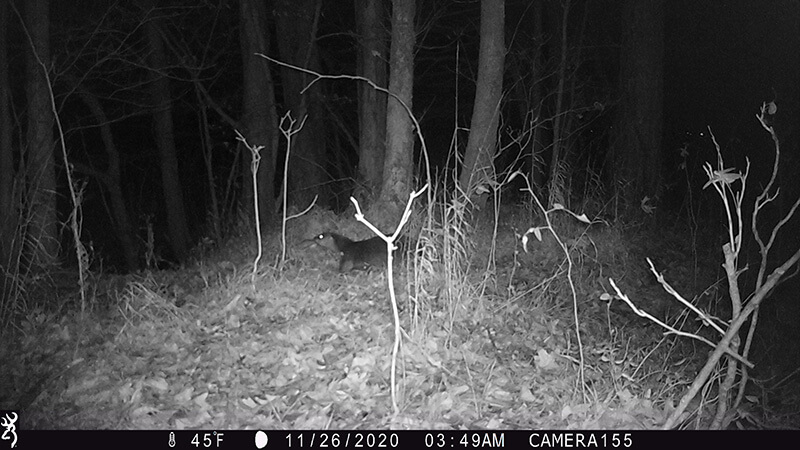
Snapshot Indiana was a volunteer-based trail camera program designed to collect information about a variety of wildlife species on private property in Indiana. During the course of five years, volunteers assisted Indiana DNR by deploying trail cameras on their 10+ acre properties for a minimum of 30 days during October and November. Volunteers provided information about the location and habitat around the cameras they set. Indiana DNR staff viewed the photos and identified the wildlife species to understand what species were present on private property. This was important, as around 95% of Indiana’s land is in private ownership, and it’s difficult to get information about wildlife on these lands without help from landowners. More than 450,000 photos were collected during the five years of the program.
Thank you to the volunteers who collected trail camera photos during the program. Snapshot Indiana would not have been possible without your efforts.
Currently, Indiana DNR does not have a volunteer-based trail camera project. Those interested can find other ways to volunteer with DFW or participate in other volunteer monitoring projects. Have a mammal you think is unique on your trail camera? See if it's a species of interest and reportable on the Report a Mammal form.
About the interactive dashboard
- How to use this dashboard
The Snapshot Indiana interactive map was designed to show the information gathered during the program. It contains toggles that display detection rates, photos, camera deployments, and active camera days on the map.
To switch between different views, select a category next to the map (e.g., detection rate, camera days) and a year you want to view.
Switch between species by using the drop-down menu on the left side under the “Select Species” heading.
Once you’ve selected a view and species, if applicable, hover your mouse pointer over a county or tap on a county on your mobile device to see the data associated with that view.
Click the link to see a table of data for the different views.
The camera deployments and active camera days views include all species, and the map will not change if you switch between species.
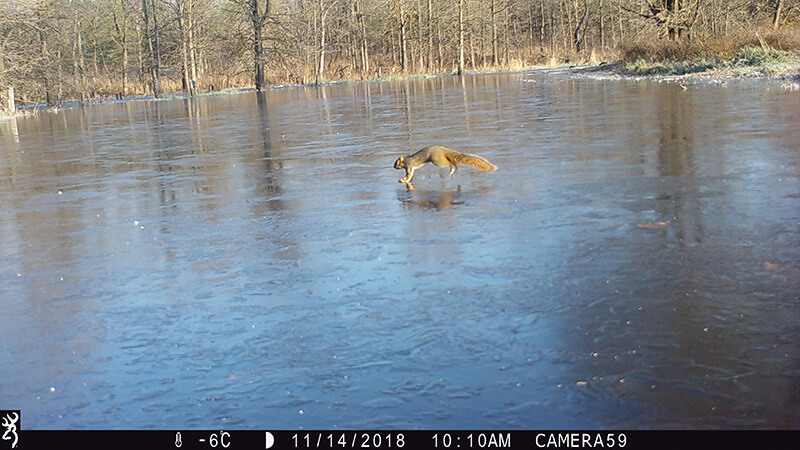
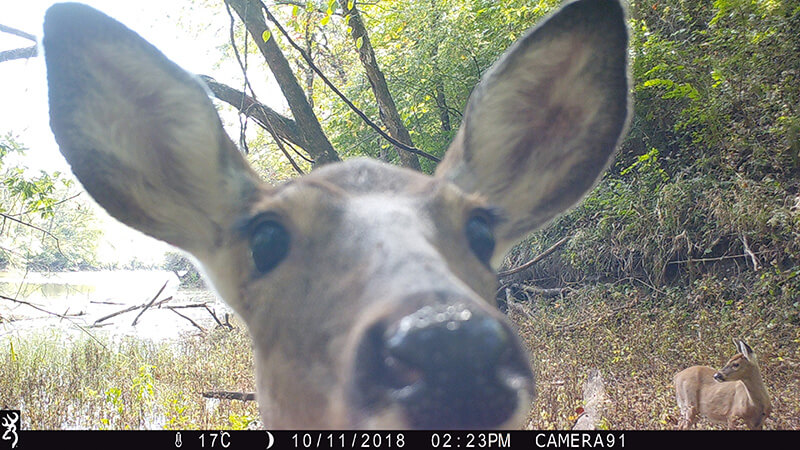
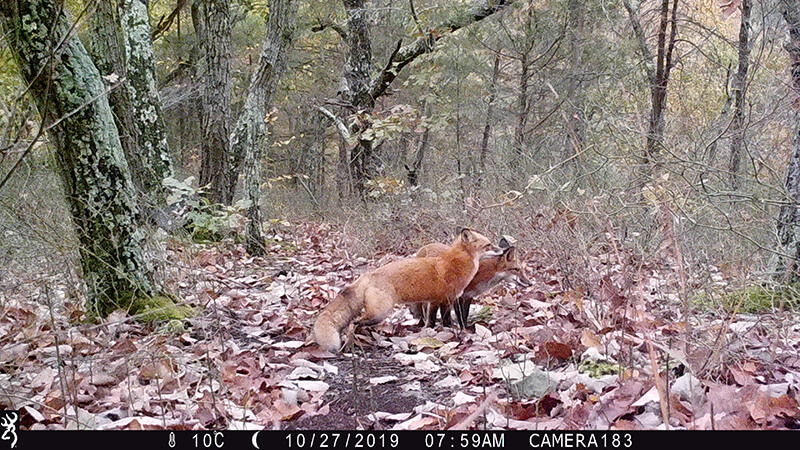
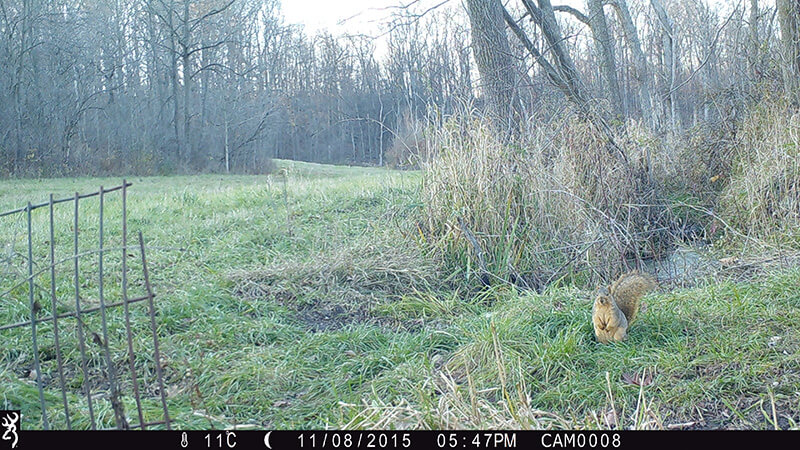
Photos were a critical part of this project. Some photos are included in the dashboard, but there are many more photos than we could make available. We selected a standout photo for each species for each year it was detected. While you are in the detection rate or photo map view, each time you change years and species, you should see a new photo if that species was detected that year.
- What species are present in the data
Snapshot Indiana did not target specific species. Species listed in the dashboard were detected at least once during the five years of the project. Species not listed were not detected or were excluded (e.g., domesticated cats and dogs).
- How to interpret the data
Detection Rate:
- The number of animal detections per camera day.
- A “detection” is an occurrence of an individual animal. It assumes that photos of the same species within a timeframe (e.g., five minutes) are the same individual and therefore count as one detection. This method is a consistent way to account for animals feeding or resting in front of the camera for long periods.
- Detection rates give us a better feel for how many white-tailed deer might have been using a camera location than just the total number of deer photos would.
Camera days:
- The number of days cameras were available to take photos of wildlife. This is important for determining detection rates.
- A camera day is one trail camera set for one day. The number of detections is divided by the total number of camera days to calculate the detection rate, or detections/day. For example, 1.67 raccoons/day for Elkhart County in 2020.
Photos:
- The total number of photos that displayed that species.
- Some photos may have had more than one species in them and were counted as one photo for each species.
Camera deployment:
- The number of cameras set in each county.
- Because this was a volunteer effort, not every county had a volunteer every year. Some counties may not have had a volunteer during any of the five years of the project.
Data from some cameras could not be used because of mechanical problems, no wildlife photos, or other errors. If you or someone you know was a volunteer and that camera is not represented, it is possible the information was not able to be included because of one of these reasons.
- How DNR uses the data
Indiana DNR uses these photos for a variety of things. One is an effort to engage people with the wildlife close to their home. Photos from Snapshot Indiana are occasionally on our website, on social media, in e-newsletters, or in the Hunting & Trapping Guide. We hope you use the map below to see what types of interesting wildlife might be in your neighborhood right now.
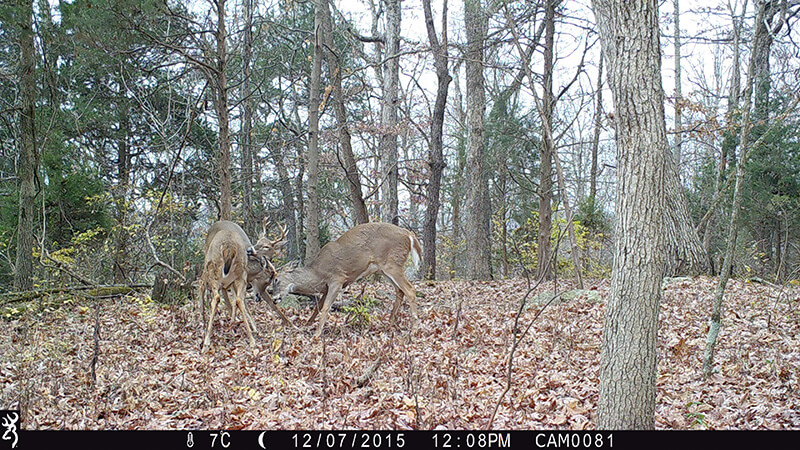
Biologists use aspects of the data to help inform management. For example, staff classified deer in photos as bucks, fawns, and does to generate buck-to-doe and fawn-to-doe ratios, which can be an indicator of Indiana’s deer herd health. Gray fox detections were included in a model to predict gray fox presence as part of a larger gray fox research project. Bobcat detections from Snapshot Indiana contributed to the development of a bobcat population model.
Snapshot Indiana data is a wealth of information to Indiana DNR staff and will continue to find new uses and purposes in the coming years.
Questions? Email wildlifeindex@dnr.IN.gov.
This dashboard is best viewed on a desktop or laptop computer. It may take a few minutes to load, please be patient.