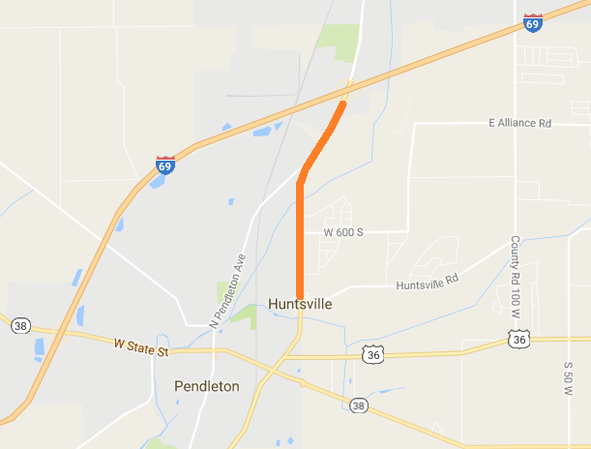
INDOT has awarded a $4.6 million contract to E & B Paving for a combined construction project on State Road 9 (38/67) that will modernize a variety of infrastructure between Interstate 69 and Huntsville Road.
Major features of the project include repairing and resurfacing pavement, replacing a box culvert at Prairie Creek, and adding left turn lanes and installing new traffic control signals at Huntsville Road. Starting Tuesday, February 28, the right lane of northbound State Road 9 will be closed for approximately three weeks as paving crews strengthen the shoulders in preparation for shifting traffic lanes in April.
Crews will begin clearing right-of-way to prepare the project site for utility relocations. Motorists may encounter temporary lane closures while this preliminary work is taking place.
The highway will remain open as road construction will be performed one-half at a time. Traffic will be reduced to one lane in each direction and shifted to share one half of the roadway. A start date will be announced before road construction begins this spring.
While traffic is shifted, some access at intersections such as Huntsville Road may be closed to and from one side of the highway. Access will be maintained to all homes and businesses.
At least one half of the project is expected to be complete this year. All work on the project is expected to be complete by the end of 2018.
Latest News
Stay informed
Follow INDOT East Central on Facebook and @INDOTEast on Twitter.
Motorists can learn about highway work zones and other traffic alerts at indot.carsprogram.org, 1-800-261-ROAD (7623) or 511 from a mobile phone.
Contact Information
INDOT Customer Service
Phone: 855-INDOT4U (463-6848)
Email: eastcentralin@indot.in.gov