Table of Contents

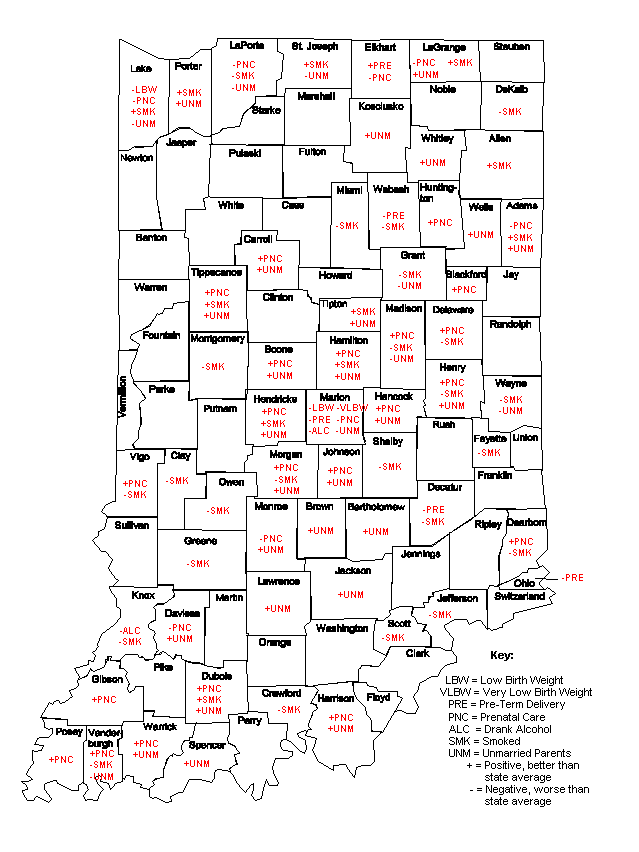
Figure 22. Significant Outcome Indicators: Indiana Counties, 1999

This figure is geographical map of Indiana showing whether outcome indicators such as low birth weight, prenatal care, smoked etc. of each county were significantly higher or lower than the state average in 1999

Table of Contents