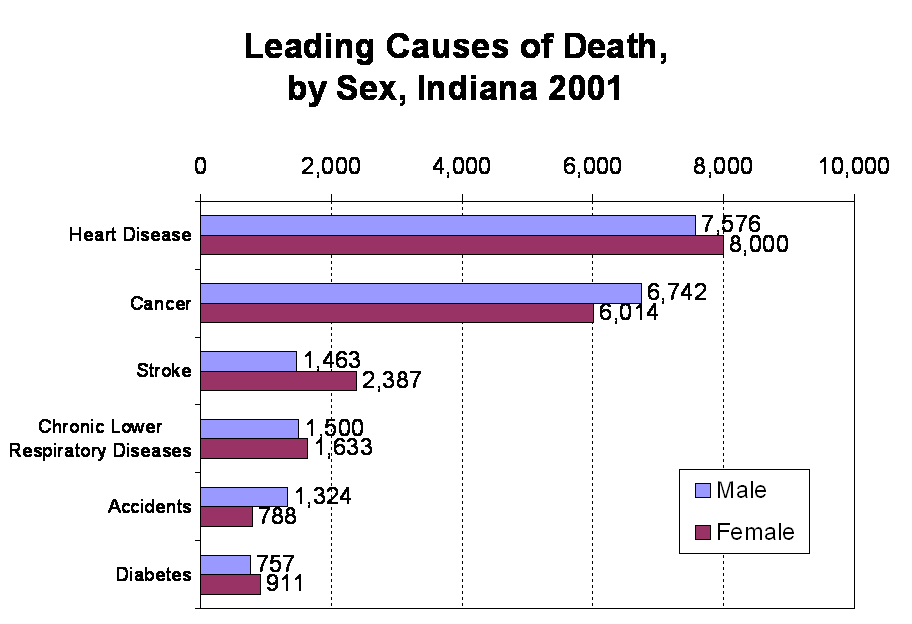
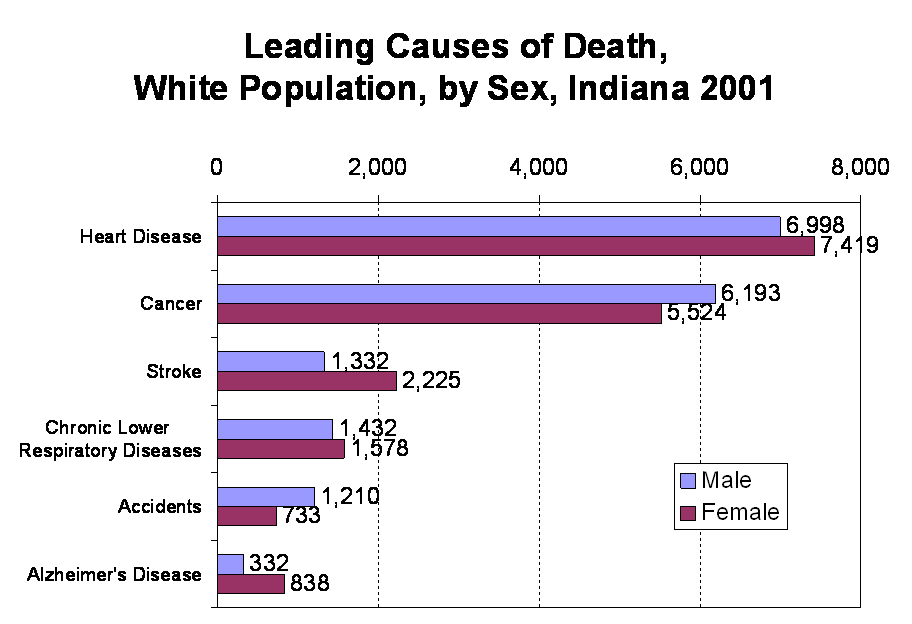
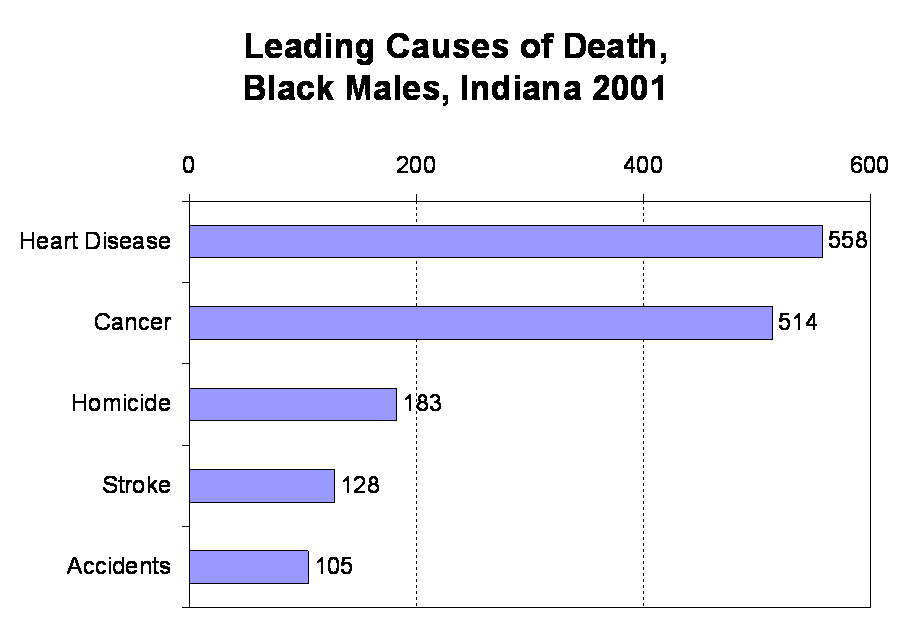
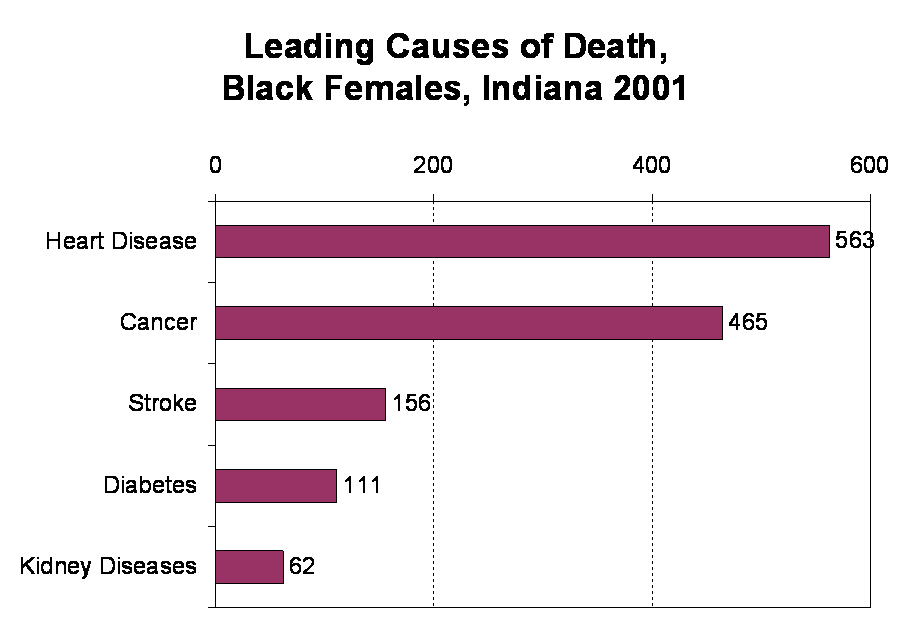
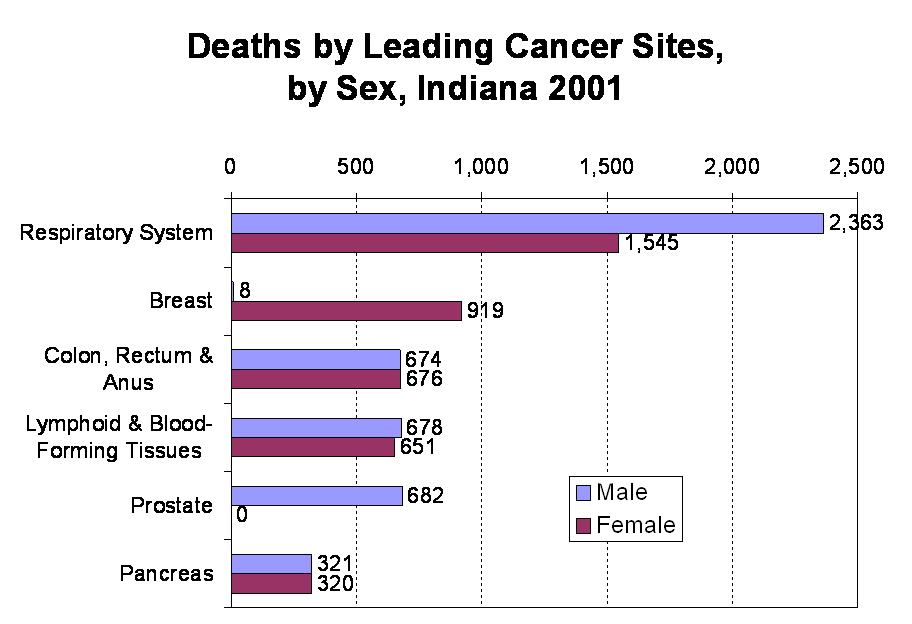
Text Highlights        Table of Contents

This figure shows the leading causes of death, by sex, for Indiana for 2001 as a bar chart.

This figure shows the leading causes of death for the white population, by sex, for Indiana for 2001 as a bar chart.

This figure shows the leading causes of death for black males, for Indiana for 2001 as a bar chart.

This figure shows the leading causes of death for black females, for Indiana for 2001 as a bar chart.

This figure shows deaths by leading cancer sites, by sex, for Indiana for 2001 as a bar chart.

This figure shows the leading causes of death for children 1-14 years, for Indiana for 2001 as a bar chart.

This figure shows the leading causes of deat for white children under age 1, for Indiana for 2001 as a bar chart.

This figure shows the leading causes of death for black children under age 1, for Indiana for 2001 as a bar chart.