2000 Indiana Report of Infectious Diseases |
View ISDH's basic facts on sexually transmitted diseases (STD's)
View CDC's Chlamydia in the United States page
Rates presented are per 100,000 population and are based on the U.S. 2000 Census.
| Cases | Incidence Rate |
|
| Total | 13,986 | 253.3 |
| Race-specific cases and rates1 | ||
| White | 5,051 | 94.0 |
| Black | 5,588 | 1,122.1 |
| Other2 | 335 | 454.2 |
| Sex-specific cases and rates3 | ||
| Female | 10,875 | 356.4 |
| Male | 3,081 | 106.5 |
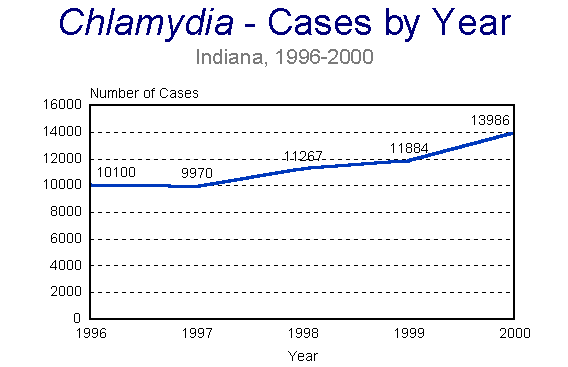
While Chlamydia trachomatis has been known to cause sexually transmitted genital infection for a number of years, economical and practical diagnostic methods were not available to physicians until recently. Recent innovations in Chlamydia testing have made test results much more accurate than had been true previously. Figure Chl1 shows the change in the number of reported cases from 1996 to 2000. Changes in testing methods may account for the increase in the number of reported cases in 2000 and will play an even greater role in year 2001 data, when even more accurate tests become available. Increases also occur as screening sites funded through the Indiana State Department of Health (ISDH) are added to the program, giving more women the opportunity to be tested for Chlamydia.
There is a higher prevalence of Chlamydia in females; however, these data must be interpreted with caution, because Chlamydia screening programs preferentially test females. This is largely due to the screening of young females at high risk of infection through the federally funded efforts of the Indiana Sexually Transmitted Diseases (STD) Program and the Indiana Family Health Council. Chlamydia infection in males is often diagnosed as non-gonococcal urethritis, which is not reportable. This has led to an underestimation of Chlamydia morbidity in males. As family planning clinics begin to see male patients and STD clinics begin to test males for Chlamydia, this reporting difference may begin to decrease.
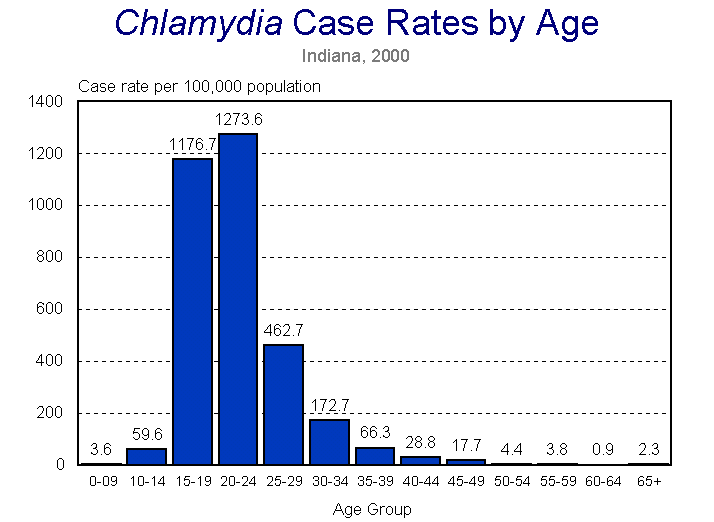
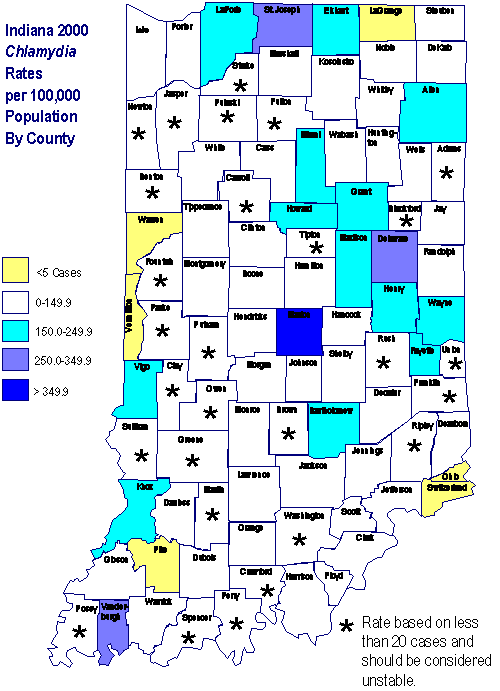
Figure Chl2 clearly shows that the highest age-specific incidence rates continue to in those ages 15-19 and 20-24 with little Chlamydia infection after age 40. In 2000, the greatest increase in morbidity occurred in those ages 20-24 with an increase of nearly 1,000 cases over 1999. Figure Chl3 shows the incidence of Chlamydia by county in Indiana for 2000.
Back to Top of Article
Back to Table of Contents
|
|
Back to Reference in Text
Back to Top of Article
|
Figure Chl2: Chlamydia - Incidence Rate by Age Group, Indiana, 2000 |
|
|
Back to Reference in Text
Back to Top of Article
|
Figure Chl3: Chlamydia - Incidence Rates by county, Indiana, 2000 |
|
|
Back to Reference in Text
Back to Top of Article
1 - Race was unknown for 3,012 of the reported cases.
2 - "Other" includes American Indian/Alaska Native, Asian, Native Hawaiian/Pacific Islander, and multiracial.
3 - Sex was unknown for 30 of the
reported cases.
Back to Table of Contents