In May 2020, the Indiana Department of Natural Resources launched the Indiana Trail Count Analysis, a statewide study of volunteer-based convenience sample trail count data. By partnering with trail managers and stakeholders across the state who were previously collecting data from fixed counters on their respective trails, the DNR was able to create a more current and comprehensive trail data set. The goal of this analysis is to use this convenience sample data to document, track, and better understand major trail-use trends in Indiana.
Trail Count Analysis Dashboard
![]()
The Indiana Trail Count Analysis dashboard displays data from over 100 trail counters across the state from 2017-2021. To use:
- View the dashboard
- Select a year or trail type to filter the map data
- Click on a trail counter from the counter list to zoom in on the select counter
- Click the home button on the map to reset the map view
2019 – 2020 Comparison Summary
Total Trail Count
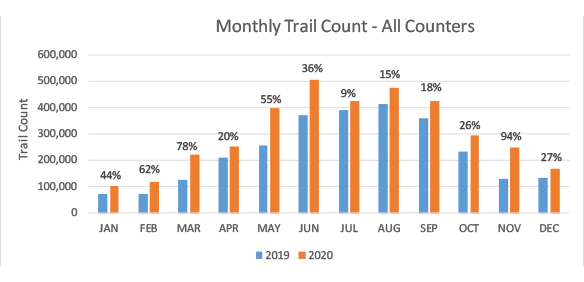
| Month | 2019 | 2020 | Change |
|---|---|---|---|
| JAN | 70,583 | 101,585 | 44% |
| FEB | 72,220 | 117,012 | 62% |
| MAR | 124,370 | 221,987 | 78% |
| APR | 209,979 | 251,612 | 20% |
| MAY | 256,267 | 398,273 | 55% |
| JUN | 369,632 | 503,872 | 36% |
| JUL | 389,332 | 426,306 | 9% |
| AUG | 414,691 | 474,878 | 15% |
| SEP | 360,209 | 423,828 | 18% |
| OCT | 233,673 | 293,423 | 26% |
| NOV | 128,570 | 248,826 | 94% |
| DEC | 133,060 | 169,261 | 27% |
| TOTAL | 2,762,586 | 3,630,864 | 31.4% |
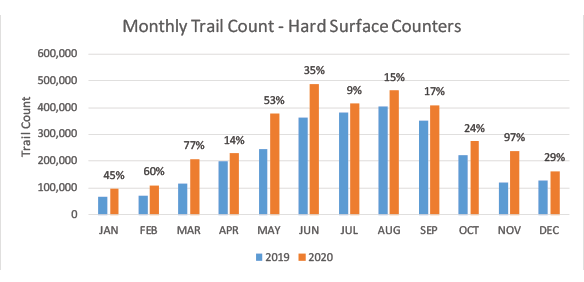
| Month | 2019 | 2020 | Change |
|---|---|---|---|
| JAN | 66,814 | 96,761 | 45% |
| FEB | 68,731 | 110,215 | 60% |
| MAR | 117,092 | 207,783 | 77% |
| APR | 200,456 | 228,232 | 14% |
| MAY | 246,185 | 376,583 | 53% |
| JUN | 362,053 | 489,518 | 35% |
| JUL | 381,139 | 415,895 | 9% |
| AUG | 403,966 | 463,293 | 15% |
| SEP | 351,056 | 409,151 | 17% |
| OCT | 221,529 | 274,325 | 24% |
| NOV | 120,528 | 237,890 | 97% |
| DEC | 126,091 | 162,307 | 29% |
| Total | 2,665,640 | 3,471,953 | 30.2% |
| Month | 2019 | 2020 | Change |
|---|---|---|---|
| JAN | 3,769 | 4,824 | 28% |
| FEB | 3,489 | 6,797 | 95% |
| MAR | 7,278 | 14,204 | 95% |
| APR | 9,523 | 23,380 | 145% |
| MAY | 10,082 | 21,690 | 115% |
| JUN | 7,579 | 14,354 | 89% |
| JUL | 8,193 | 10,411 | 27% |
| AUG | 10,725 | 11,585 | 8% |
| SEP | 9,153 | 14,677 | 60% |
| OCT | 12,144 | 19,098 | 57% |
| NOV | 8,042 | 10,936 | 36% |
| DEC | 6,969 | 6,954 | 0% |
| Total | 96,946 | 158,911 | 63.9% |
2019-2020 Findings
Based on counts from 65 trail counters around the state (see map below), trail use is shown to have increased more than 31% in 2020 from the previous year. Each month in 2020 saw more trail use compared to the same month in 2019, ranging from increases of 9% to 94%.
Hard-surface trails saw the majority of trail counts in our analysis, with a peak of 97% increase in the month of November. Despite representing less of the total trail counts, natural-surface trails saw the biggest increase, almost 64%, in 2020. Of note, natural-surface trail counts increased more than 100% in the months of April and May.
The data reflects a clear and significant rise in trail use in 2020. This rise in Indiana is consistent with trail use increases documented across the country as well as an uptick in many other outdoor recreation activities such as paddling, bicycling, camping, and off-roading. Some of this increase is thought to have been spurred by the COVID-19 pandemic, but the sustained trend shows that Hoosiers are eager to get outside more and enjoy the many benefits trails have to offer. The results of the 2019-2020 Trail Counts Analysis indicate a high demand for and interest in trails across the state.
2019-2020 Trail Data was collected from 65 trail counters over 16 counties.
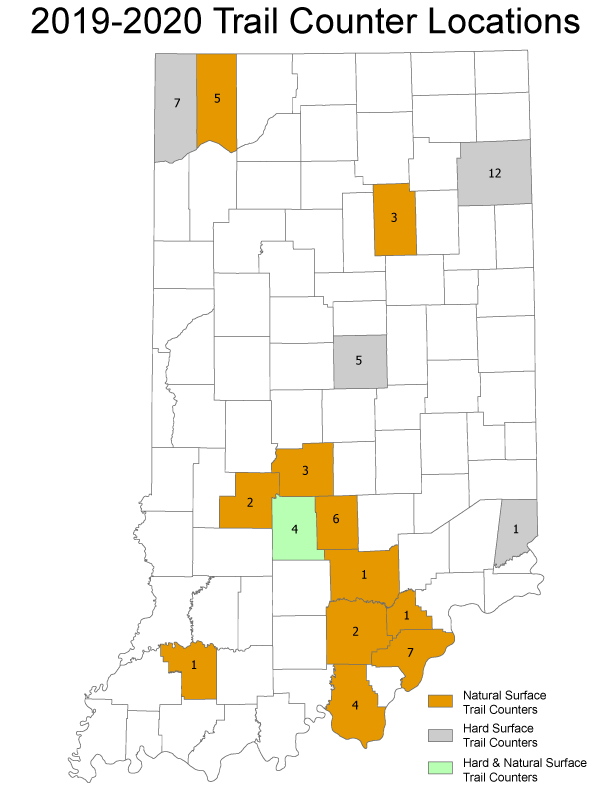
- Trail Count Partners and Counter Locations
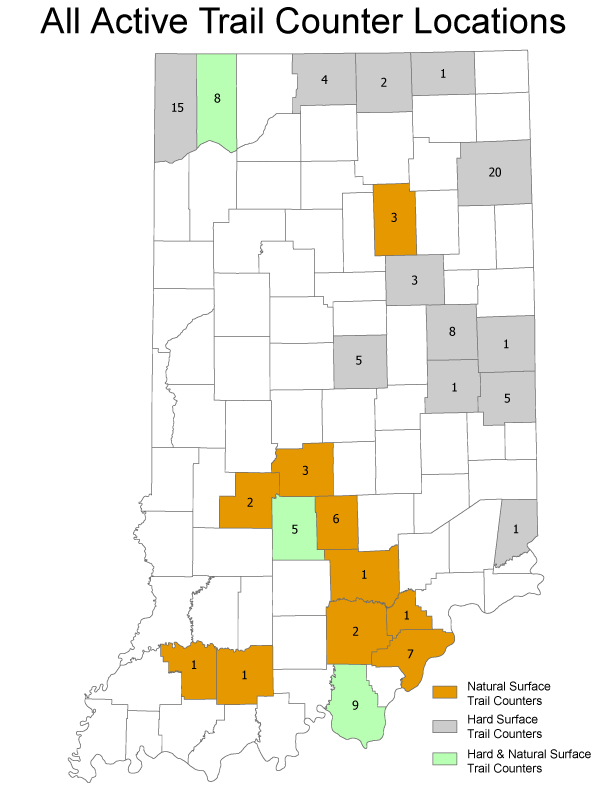
The Indiana Trail Count Analysis is made possible by all the trail organizations, agencies, trail managers, and stakeholders who voluntarily send their trail-count data to the DNR for analysis. The 2019-2020 analysis was compiled from the data retrieved from 65 trail counters. Each year trail managers are adding more counters to their trails. Coupled with the additional collaborating organizations, the DNR is now compiling data from more than 110 counters from around Indiana. With more counters, future yearly analyses will create a more accurate snapshot of trail trends in the heartland.
All Trail Counter Locations
Partners
The DNR thanks the trail managers and stakeholders who partnered with us by voluntarily providing the trail-count data they collected on their fixed, automated counters. Partners for this important analysis, include:
- Cardinal Greenway
- City of Bloomington
- City of Carmel
- City of Fort Wayne
- Green Umbrella
- Harrison County
- Indiana DNR - Division of Forestry
- Michiana Area Council of Governments (MACOG)
- Northwestern Indiana Regional Planning Commission (NIRPC)
- Porter County
Participation and more information
For those interested in trail counters in general or national studies, more resources can be found at:
Trail managers or stakeholders who have access to trail-counter data from fixed, automated trail counters and are interested in participating in this ongoing analysis, please contact Allen Hurst.
If you have any questions or comments about this analysis, contact:
Allen Hurst
DNR Division of State Parks
402 W. Washington St. Rm. 271
Indianapolis, IN 46204-2782
317-232-4070
ahurst@dnr.IN.gov - Data description and limitations
- The numbers presented are monthly trail counts. They are not total trail users counted. As an example, a single trail user doing an out-and-back trip on the same trail with a single fixed counter will most likely be counted twice. Conversely, if a trail user does a loop and does not double back past the same counter, that trail user would only be counted once on that trip. Additionally, these are monthly counts. Many trail users are frequent users, using a trail several times a month, week, or even day, so those individuals may be included multiple times in a monthly count.
- Monthly trail count data sets were voluntarily provided by trail managers and stakeholders. Partners on this project include local, regional, state, and non-profit trail managers or stakeholders who manage their own counters and were already collecting trail count data for their own research. The DNR does not provide funding or trail counters to partners for this analysis.
- The data includes counts from both hard and natural surface trails. Types of trail users counted include bicyclists and pedestrians, such as walkers and runners, on hard surface trails. This includes asphalt, concrete, and crushed stone trails. On natural surface trails, most of the trail users counted are hikers, backpackers, or trail runners; there is limited data on mountain bikers and equestrian users.
- All trail counter data comes from fixed, automated trail counters. The DNR does not use manual trail counts. Most trail counters are infrared trail counters, although a few are magnetic loop. For data consistency, trail counters are placed in a fixed location.
- Only monthly trail counts are included in this analysis. Although some of the trail counters use features that distinguish between the types of trail users and the exact day and time the trail was used, not all counters have these capabilities. Therefore, the DNR chose to include all monthly recorded user types in the analysis to standardize the reported dataset as much as possible, given the variations in equipment, counter capabilities, placement, etc.
- The Indiana Trail Count Analysis uses the most recent reported trail count data sets available to the DNR. Previous summaries or reports of the analysis may have different figures or results. This is due to the DNR receiving additional or updated data sets that were then incorporated into the latest analysis. Due to a small number of counters reporting their most recent data late, some of the figures or the results in this analysis might be underreported now and corrected later as more data becomes available. Additionally, new queries may also be incorporated onto the existing data to better understand the trail counts trends. For these reasons, please use the most recent analysis and check back every few months for new summaries.