Table IV Index
Table of Contents
| Table IV - 1
Cancer - All Sites, Invasive and In Situ Indiana 1996 |
||||||
Top 10 Histologies |
||||||
| Histology | ICD-O-2 Code | Number | Percent | |||
| Adenocarcinoma | 814 | 7,997 | 30.5 | |||
| Duct cell carcinoma | 850 | 7,997 | 13.0 | |||
| Squamous cell carcinoma | 807 | 2,953 | 11.3 | |||
| Carcinoma | 801 | 1,694 | 6.5 | |||
| Papillary transitional cell carcinoma | 813 | 830 | 3.2 | |||
| Small cell carcinoma | 804 | 816 | 3.1 | |||
| Clear cell carcinoma | 831 | 630 | 2.4 | |||
| Mucinous adenocarcinoma | 848 | 585 | 2.2 | |||
| Malignant melanoma | 872 | 552 | 2.1 | |||
| Lobular carcinoma | 852 | 459 | 1.8 | |||
| 97% microscopically confirmed | ||||||
| Age and Sex | ||||||
| Age at Diagnosis |
Total Number |
Percent |
Male Number |
Percent |
Female Number |
Percent |
| 0-9 | 130 | 0.5 | 78 | 0.6 | 52 | 0.4 |
| 10-19 | 149 | 0.6 | 64 | 0.5 | 85 | 0.6 |
| 20-29 | 516 | 2.0 | 154 | 1.2 | 362 | 2.6 |
| 30-39 | 1,212 | 4.6 | 348 | 2.8 | 864 | 6.3 |
| 40-49 | 2,442 | 9.3 | 783 | 6.3 | 1,659 | 12.0 |
| 50-59 | 4,034 | 15.4 | 1,860 | 15.0 | 2,174 | 15.8 |
| 60-69 | 6,740 | 25.7 | 3,673 | 29.6 | 3,067 | 22.3 |
| 70-79 | 7,350 | 28.1 | 3,912 | 31.5 | 3,438 | 25.0 |
| 80-89 | 3,220 | 12.3 | 1,399 | 11.3 | 1,821 | 13.2 |
| 90+ | 386 | 1.5 | 129 | 1.0 | 257 | 1.9 |
| Unspecified | 1 | 0.0 | 1 | 0.0 | 0 | 0.0 |
| TOTAL | 26,180 | 100.0 | 12,401 | 100.0 | 13,779 | 100.0 |
| Race | ||||||
| Total | White | Black | Other | |||
| Number | 26,180 | 24,155 | 1,772 | 253 | ||
| Percent | 100.0% | 92.3% | 6.8% | 1.0% | ||
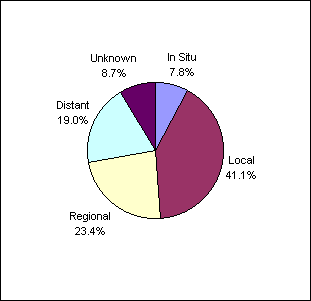
| Stage at Diagnosis | ||||||
| Total | In Situ | Local | Regional | Distant | Unknown | |
| Number | 26,180 | 2,050 | 10,752 | 6,120 | 4,973 | 2,285 |
| Percent | 100.0% | 7.8% | 41.1% | 23.4% | 19.0% | 8.7% |
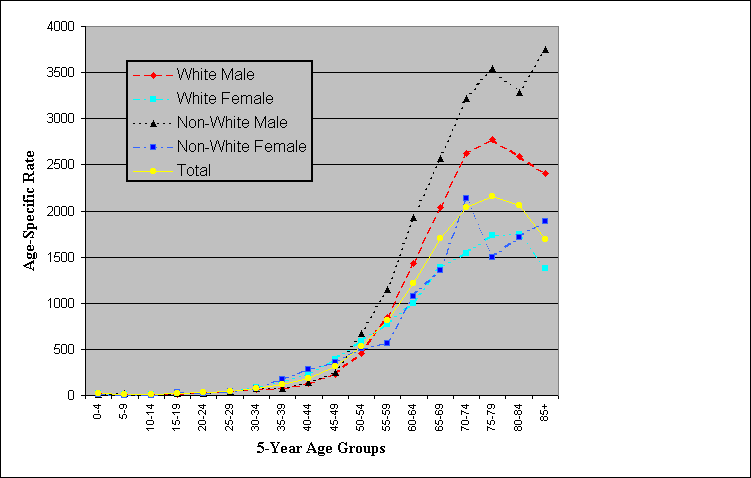
| Age-Specific Incidence Rates by Sex and Race | ||||||
| Age at Diagnosis |
White Male |
White Female |
Non-White Male |
Non-White Female |
Total | |
| 0-4 | 22.2 | 16.4 | 8.3 | 13.0 | 18.4 | |
| 4-9 | 15.7 | 10.9 | 24.9 | 4.3 | 13.6 | |
| 10-14 | 14.2 | 7.2 | 4.2 | 4.3 | 10.1 | |
| 15-19 | 15.2 | 20.2 | 24.7 | 28.8 | 18.7 | |
| 20-24 | 31.2 | 26.7 | 23.2 | 22.0 | 28.3 | |
| 25-29 | 42.0 | 47.3 | 45.0 | 39.6 | 44.4 | |
| 30-34 | 65.1 | 90.0 | 71.5 | 74.0 | 77.2 | |
| 35-39 | 80.4 | 150.1 | 71.0 | 176.1 | 116.3 | |
| 40-45 | 131.8 | 232.6 | 137.5 | 279.0 | 185.3 | |
| 45-49 | 223.8 | 393.7 | 250.6 | 357.0 | 309.5 | |
| 50-54 | 452.7 | 590.6 | 671.4 | 509.9 | 527.5 | |
| 55-59 | 845.2 | 775.0 | 1,144.6 | 564.0 | 810.2 | |
| 60-64 | 1,428.5 | 994.0 | 1,933.9 | 1,073.5 | 1,219.2 | |
| 65-69 | 2,037.1 | 1,388.6 | 2,566.7 | 1,357.9 | 1,698.4 | |
| 70-74 | 2,624.6 | 1,537.8 | 3,221.2 | 2,130.6 | 2,040.6 | |
| 75-79 | 2,775.1 | 1,739.8 | 3,540.9 | 1,498.0 | 2,159.8 | |
| 80-84 | 2,593.0 | 1,749.2 | 3,289.5 | 1,716.2 | 2,058.9 | |
| 85+ | 2,402.6 | 1,378.4 | 3,752.9 | 1,890.8 | 1,692.5 | |
Source: Indiana State Department of Health - Indiana State Cancer Registry and the Epidemiology Resource Center, Data Analysis Team, January 2001 |
||||||